






Research on impact of aircraft emissions on surrounding environment of airports
-
摘要:
为真实有效地评估航空排放污染物对机场及其周边环境的影响,构建了多因素融合下的飞机LTO(landing and take-off, 起飞降落着陆)循环排放污染物扩散评估模型。依据机载QAR(quick access recorder,快速存取记录器)数据中表征发动机实际运行的诸多参数,准确获取污染物排放量,进而确定实时排放源强;建立飞行坐标系,结合飞机实际运行状况及机场周边环境因素对Gaussian puff模型进行修正。依据飞机不同飞行阶段下排放污染物质量浓度分布,确定了污染物扩散趋势,进而完成:①排放污染物扩散质量浓度超标地理范围确定;②排放污染物对常见区域影响分析;③多架次飞机排放污染物叠加扩散影响分析;④排放污染物质量浓度监测点设置。通过计算得出装配GE90-115B型发动机的B777-300ER飞机LTO循环中排放污染物扩散峰值质量浓度主要集中在26.05~576 mg/m3范围内,进近阶段污染物排放高度集中在446.49~593.67 m,下风向污染物质量浓度超标地理范围为0~647 m;起飞爬升阶段污染物排放高度集中在起飞前期1.34~96.03 m,下风向污染物质量浓度超标地理范围为0~127 m。下风向管制区域647~1000 m污染物扩散质量浓度未超标,但对环境造成的影响不可忽视。
-
关键词:
- LTO循环 /
- QAR数据 /
- Gaussian puff模型 /
- 评估模型 /
- 影响范围
Abstract:In order to truly and effectively assess the impact of aviation pollutants on the airport and its surrounding environment, an aircraft LTO (landing and take-off) cyclic pollutant emission diffusion evaluation model under multi-factor fusion was constructed. According to the parameters characterizing the actual operation of the engine in the airborne QAR (quick access recorder) data, the pollutant emissions can be accurately obtained, and then the real-time emission source strength can be determined; the flight coordinate system was established, and the actual operating conditions of the aircraft were combined. The surrounding environmental factors of the airport amended the Gaussian puff model. According to the distribution of pollutant emission concentration in different flight stages of the aircraft, the pollutant diffusion trend was determined, and then: (1) the geographic range of the emission pollutant diffusion concentration exceeding the standard was determined; (2) the impact of the emission pollutants on common areas was analyzed; (3) the impact of superposition and diffusion of pollutants discharged by multiple aircraft was analyzed; (4) monitoring points for the concentration of discharged pollutants were set. Through calculation, it was concluded that the peak concentration of emission pollutants in the LTO cycle of the B777-300ER aircraft equipped with GE90-115B engines was mainly concentrated in the range of 26.05−576 mg/m3, and the pollutant emission height in the approach stage was concentrated in the range of 446.49−593.67 m, the geographical range of pollutant concentrations in the downwind direction exceeding the standard was 0−647 m; the pollutant emission height in the take-off and climbing stage was concentrated in the early stage of take-off at 1.34−96.03 m, and the pollutant concentration in the downwind direction exceeded the standard geographical range of 0−127 m. The pollutant diffusion concentration of 647−1000 m in the downwind control area did not exceed the standard, but the impact on the environment cannot be ignored.
-
Key words:
- LTO cycle /
- QAR data /
- Gaussian puff model /
- evaluation model /
- scope of influence
-

图 1 LTO阶段排放污染物扩散评估流程图
Figure 1. Flow chart of assessment of diffusion of pollutants discharged in LTO stage
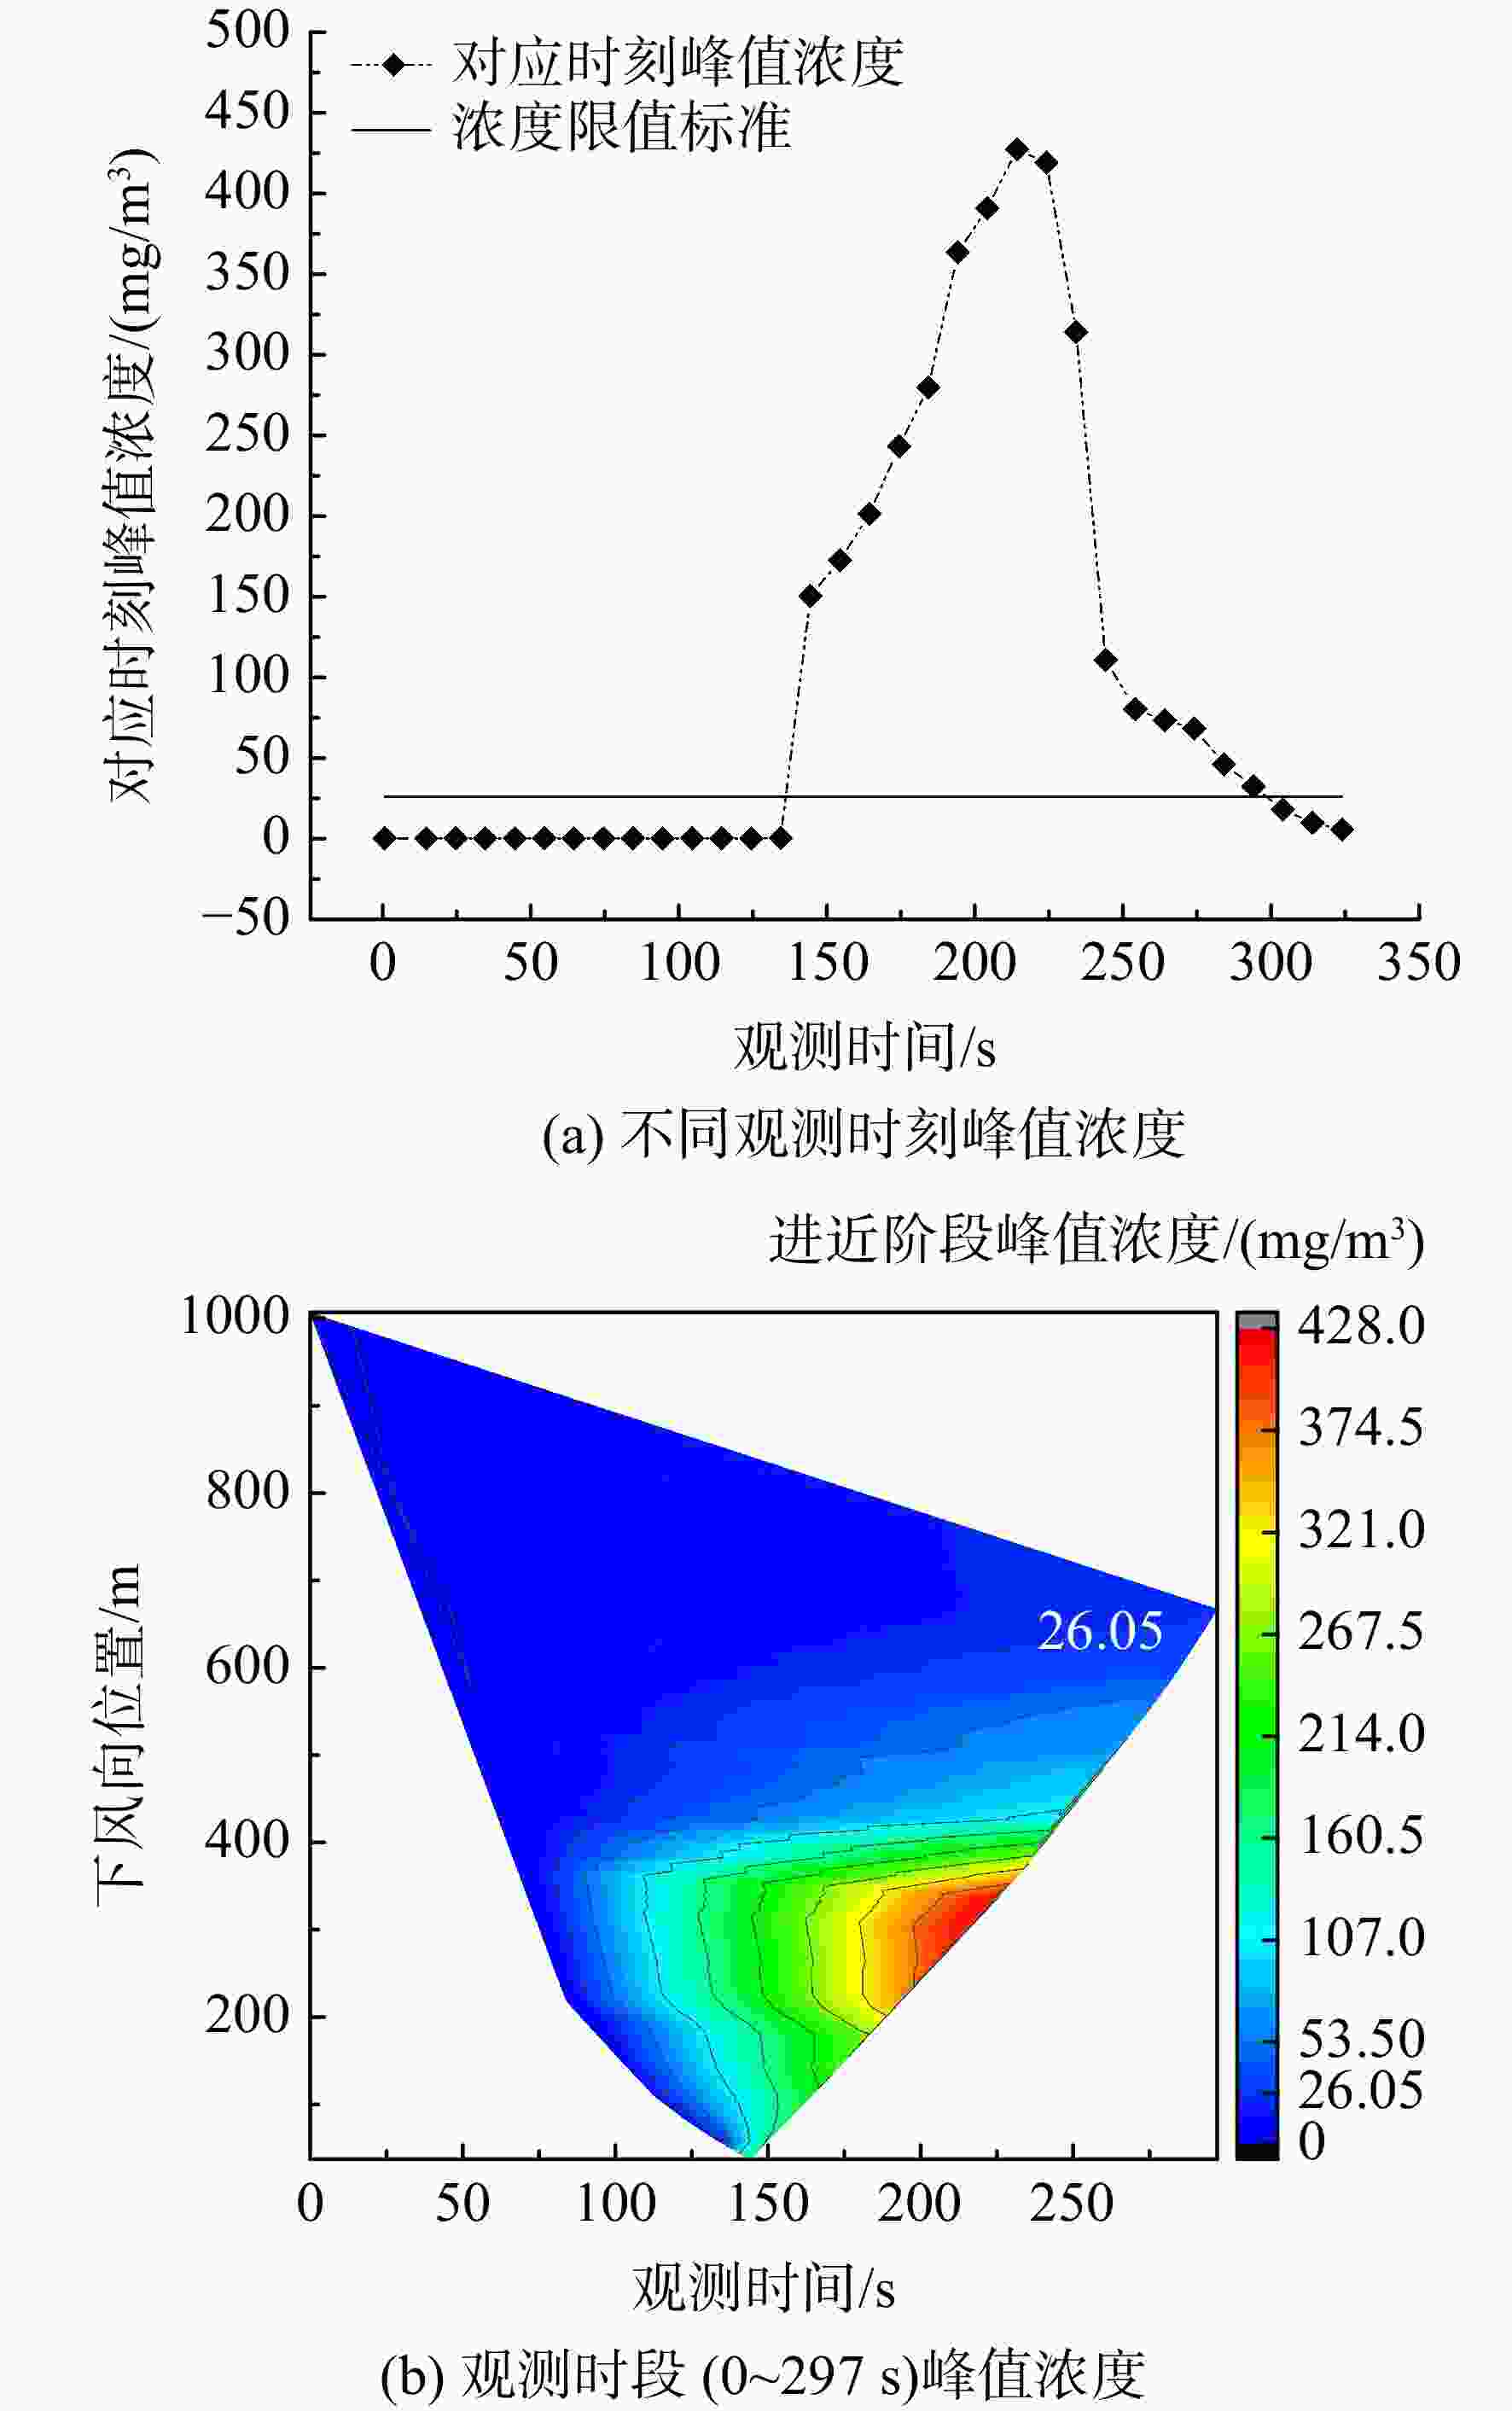
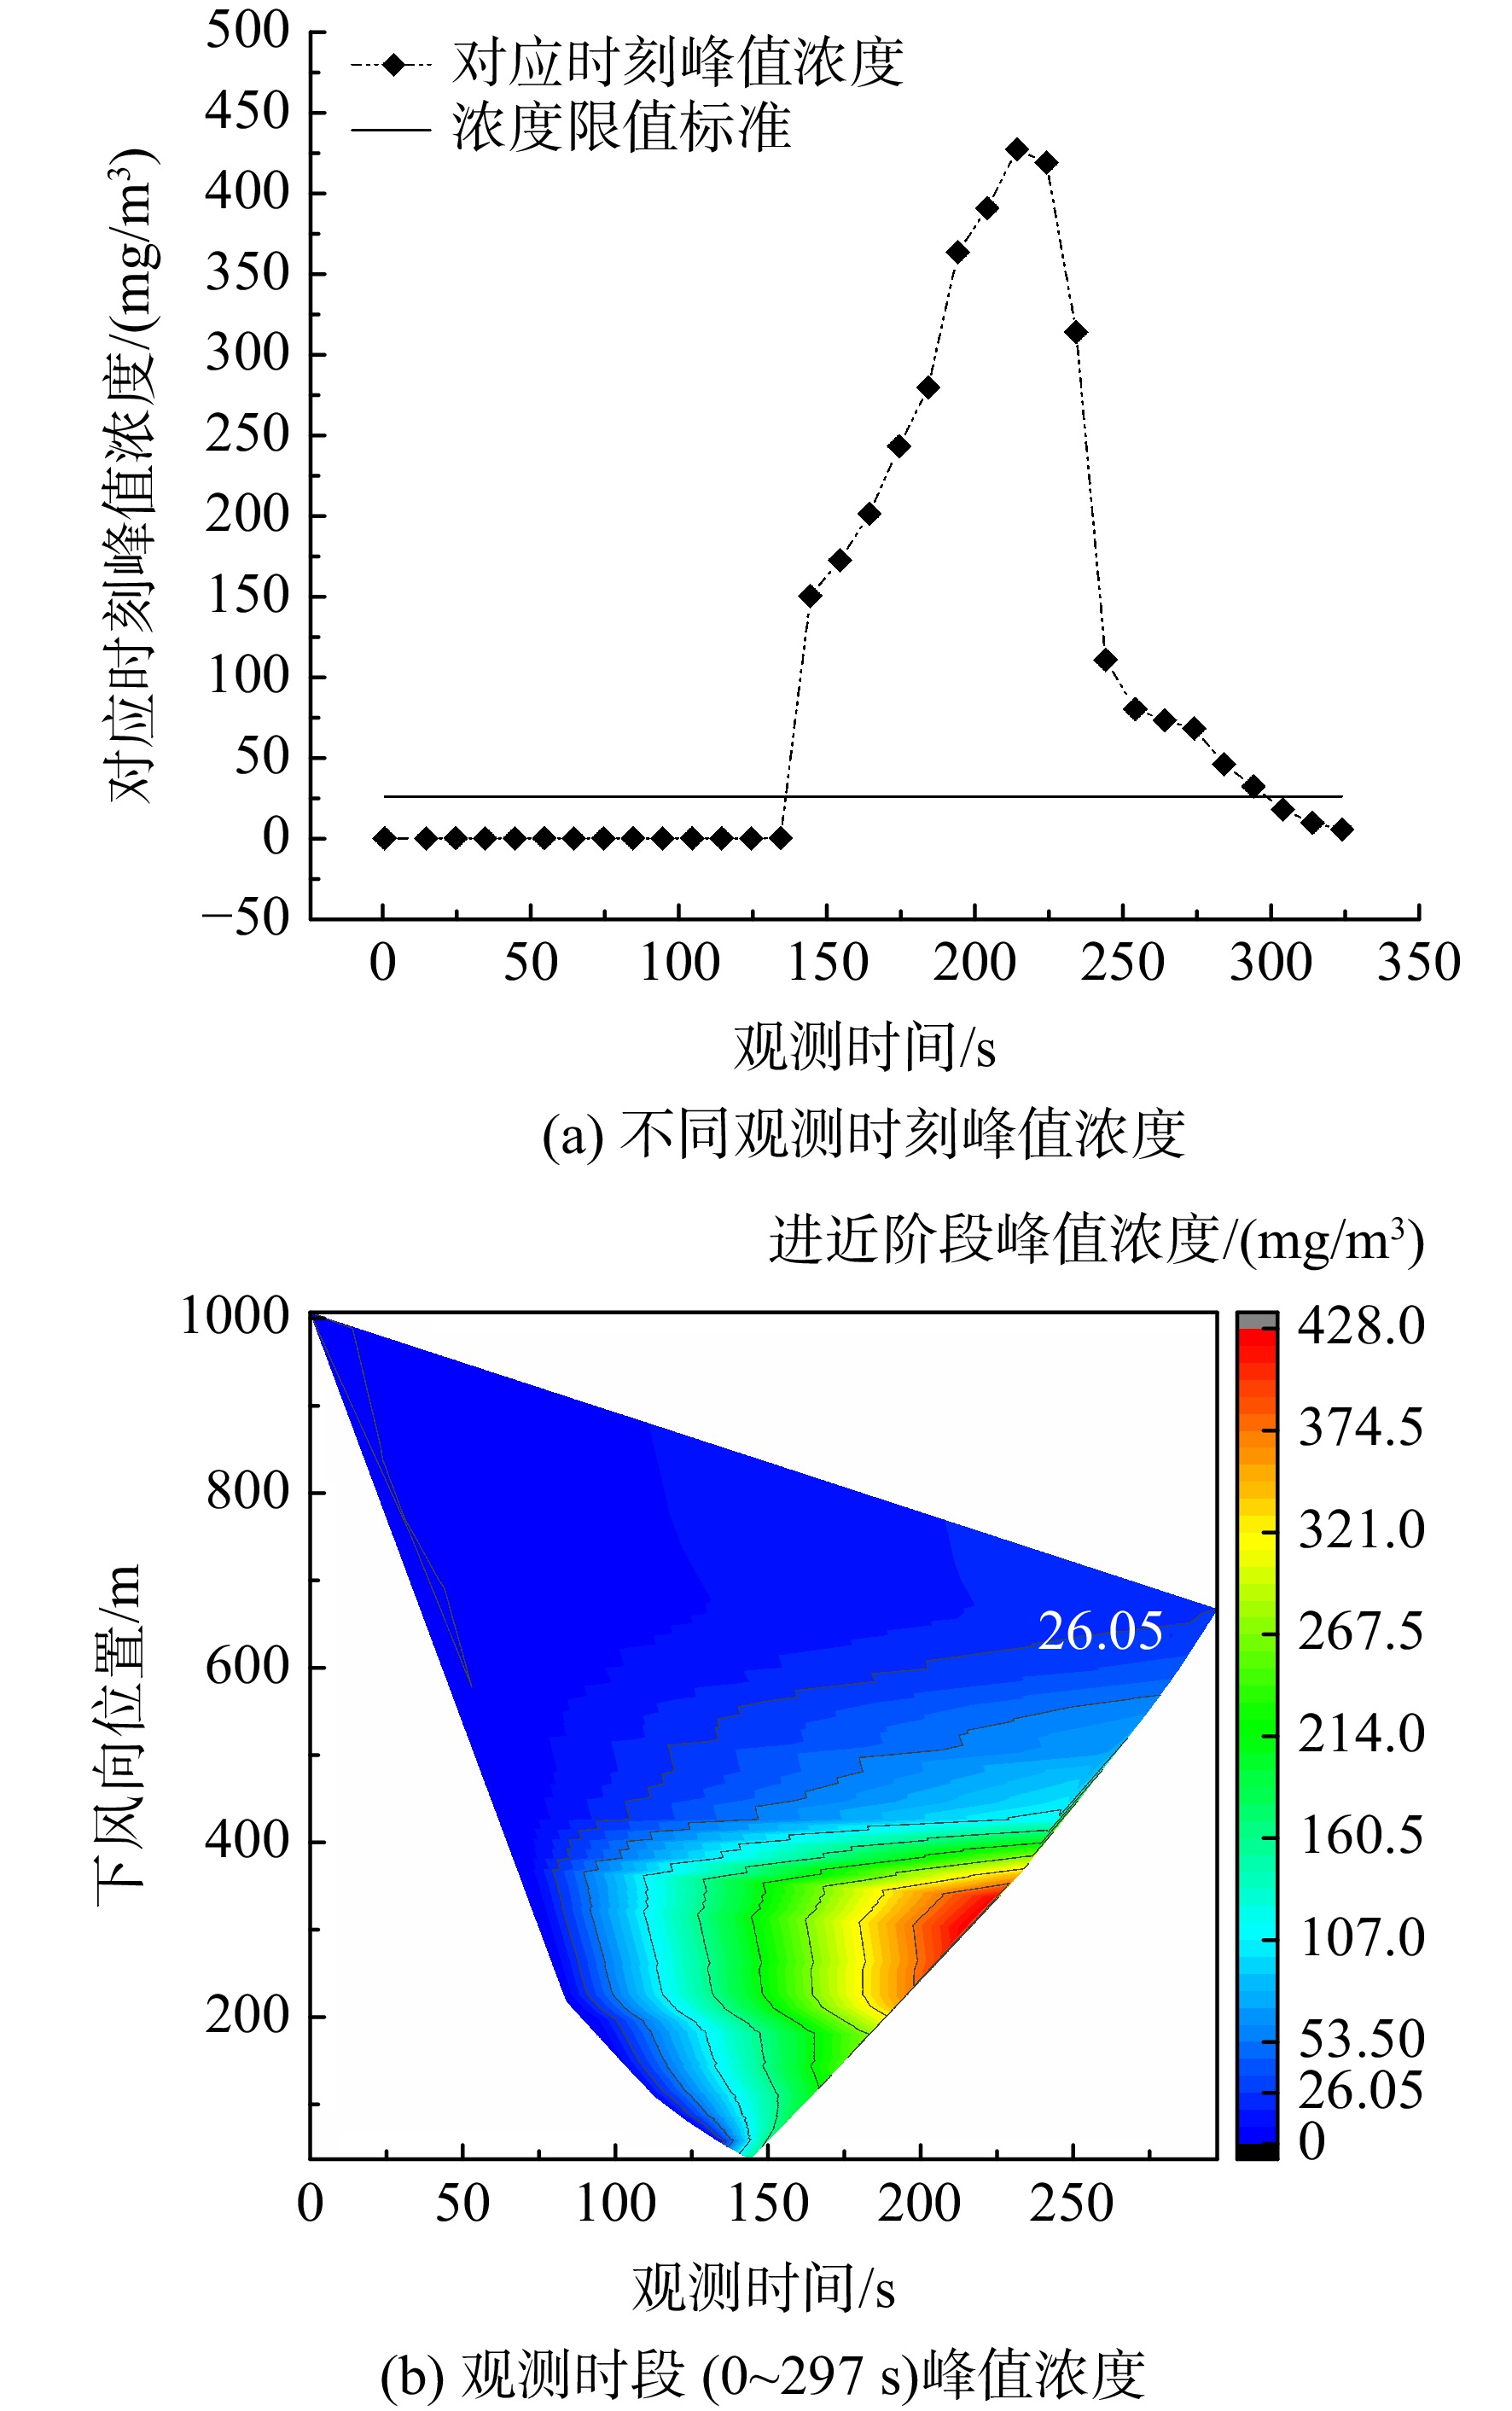
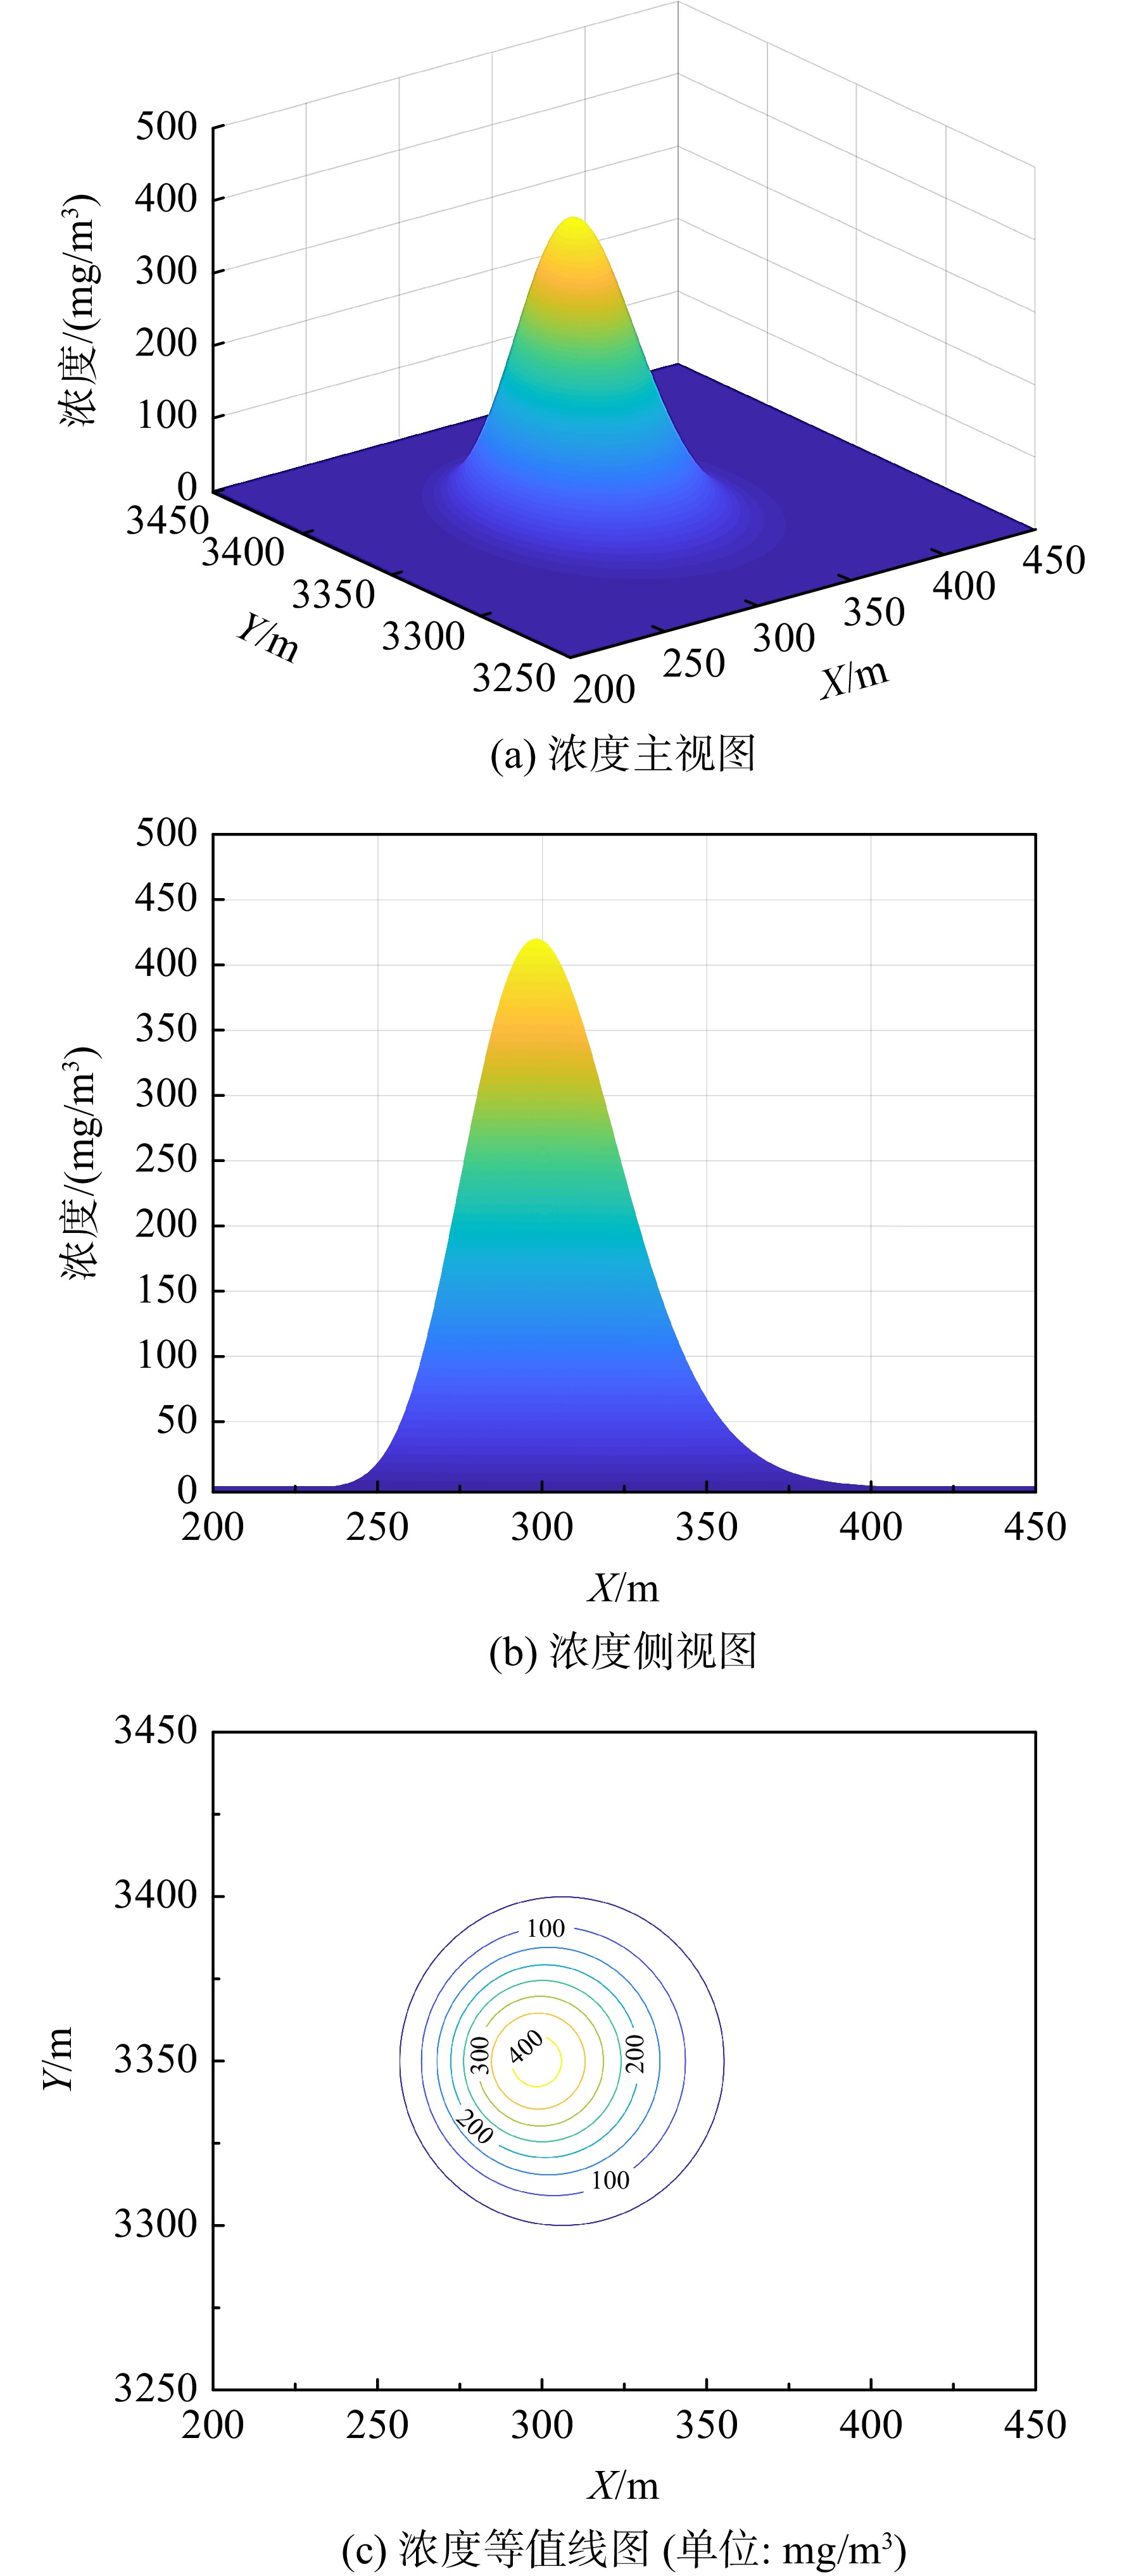
图 5 进近阶段不同观测时刻、观测时段内污染物扩散峰值浓度分布图
Figure 5. Distribution of pollutant diffusion peak concentration at different observation times and observation periods during approach phase
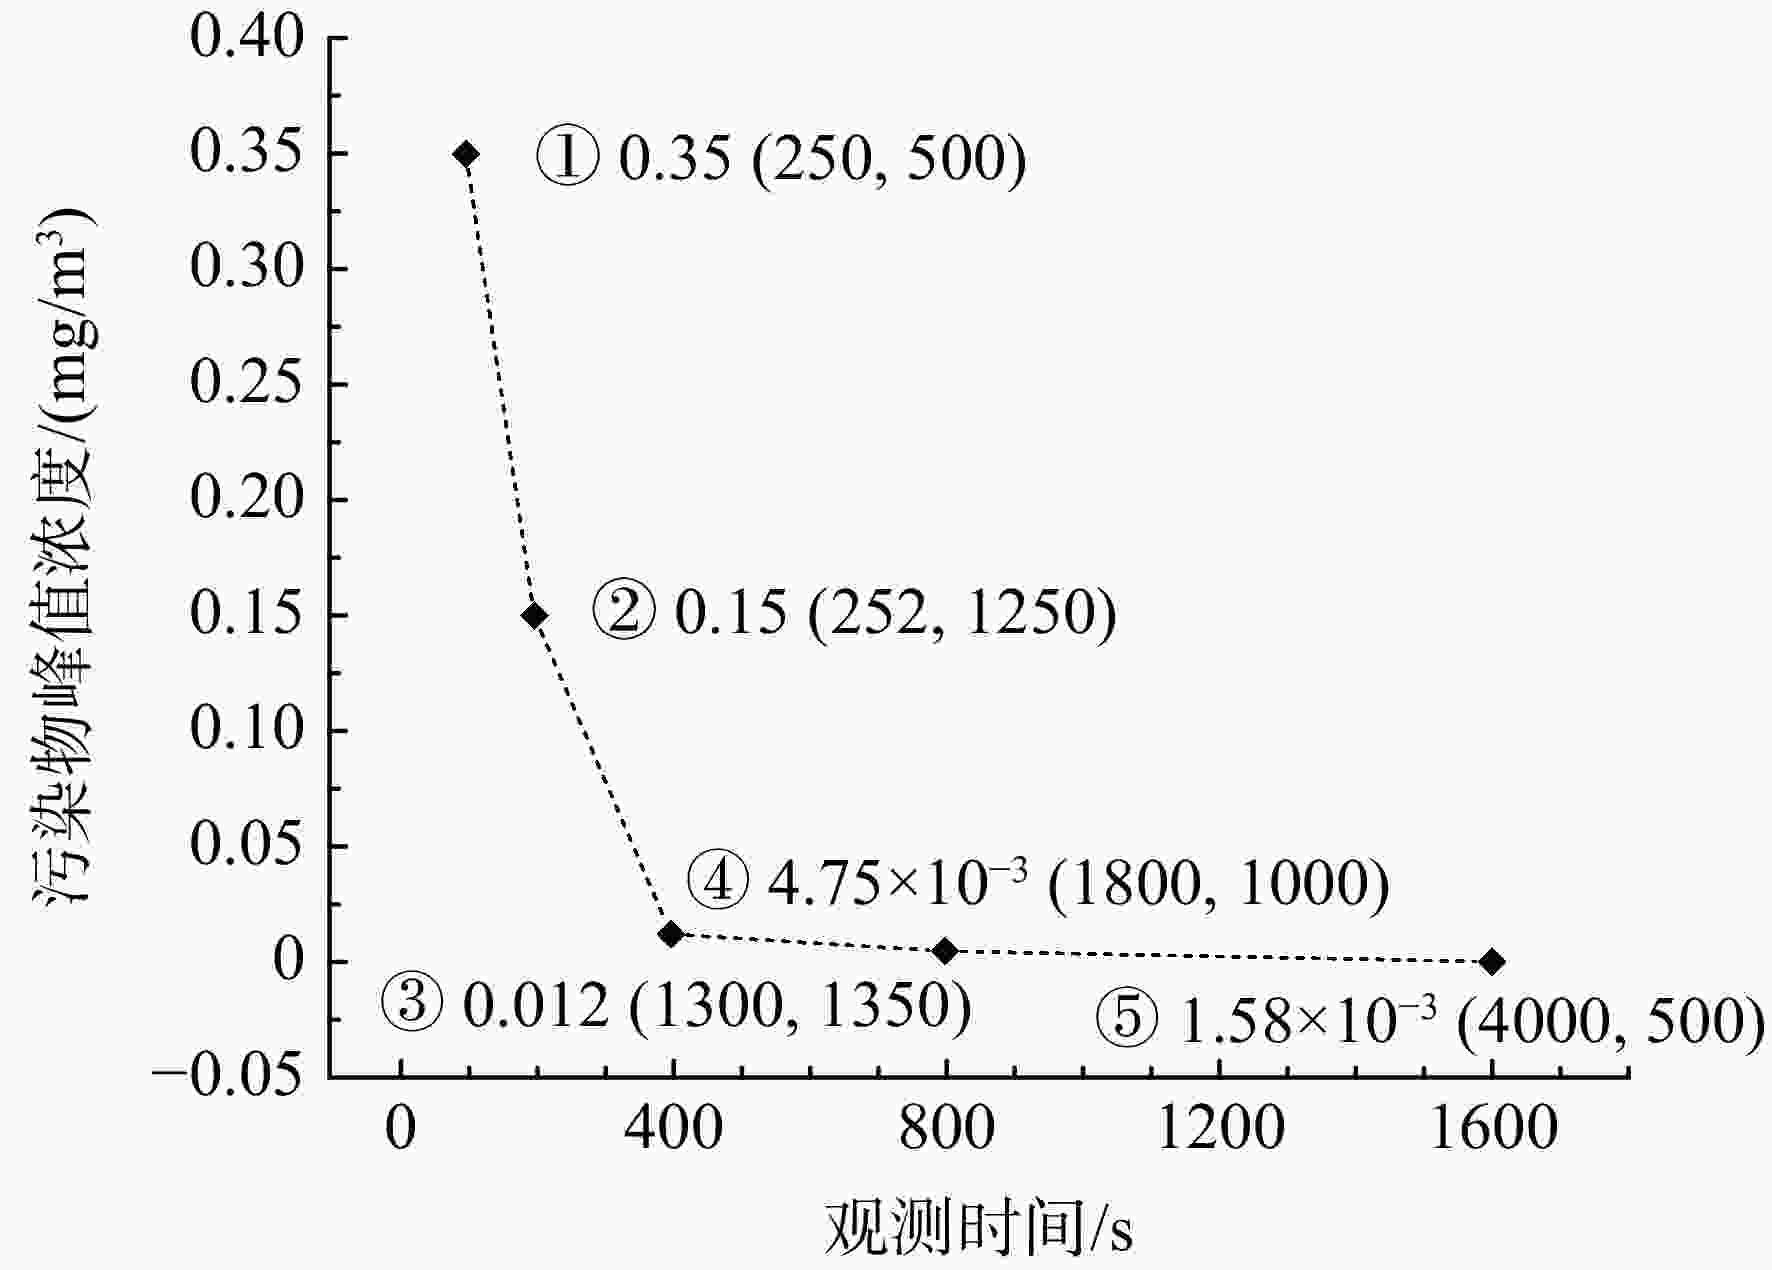
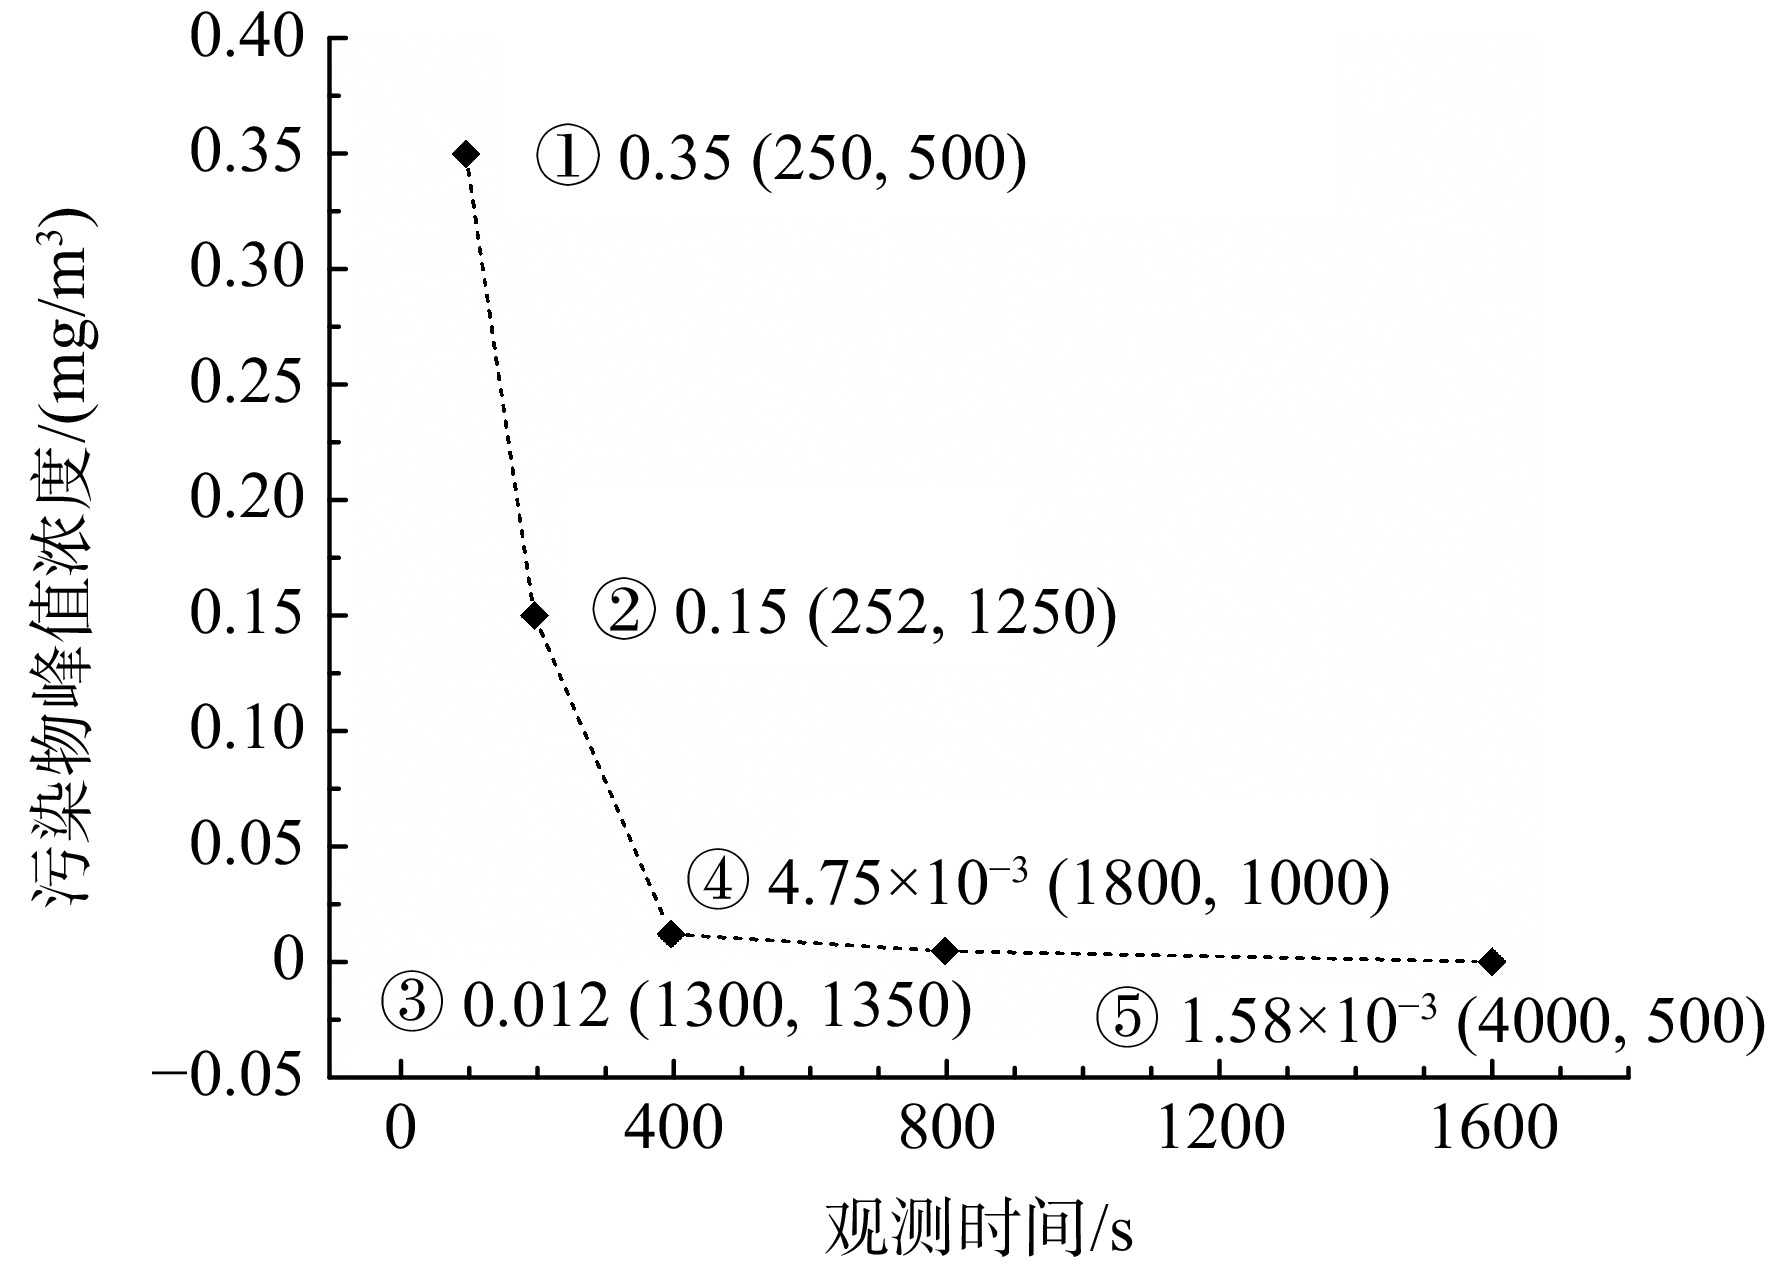
图 7 滑行阶段污染物扩散峰值浓度分布图
Figure 7. Distribution of pollutant diffusion peak concentration during taxiing stage
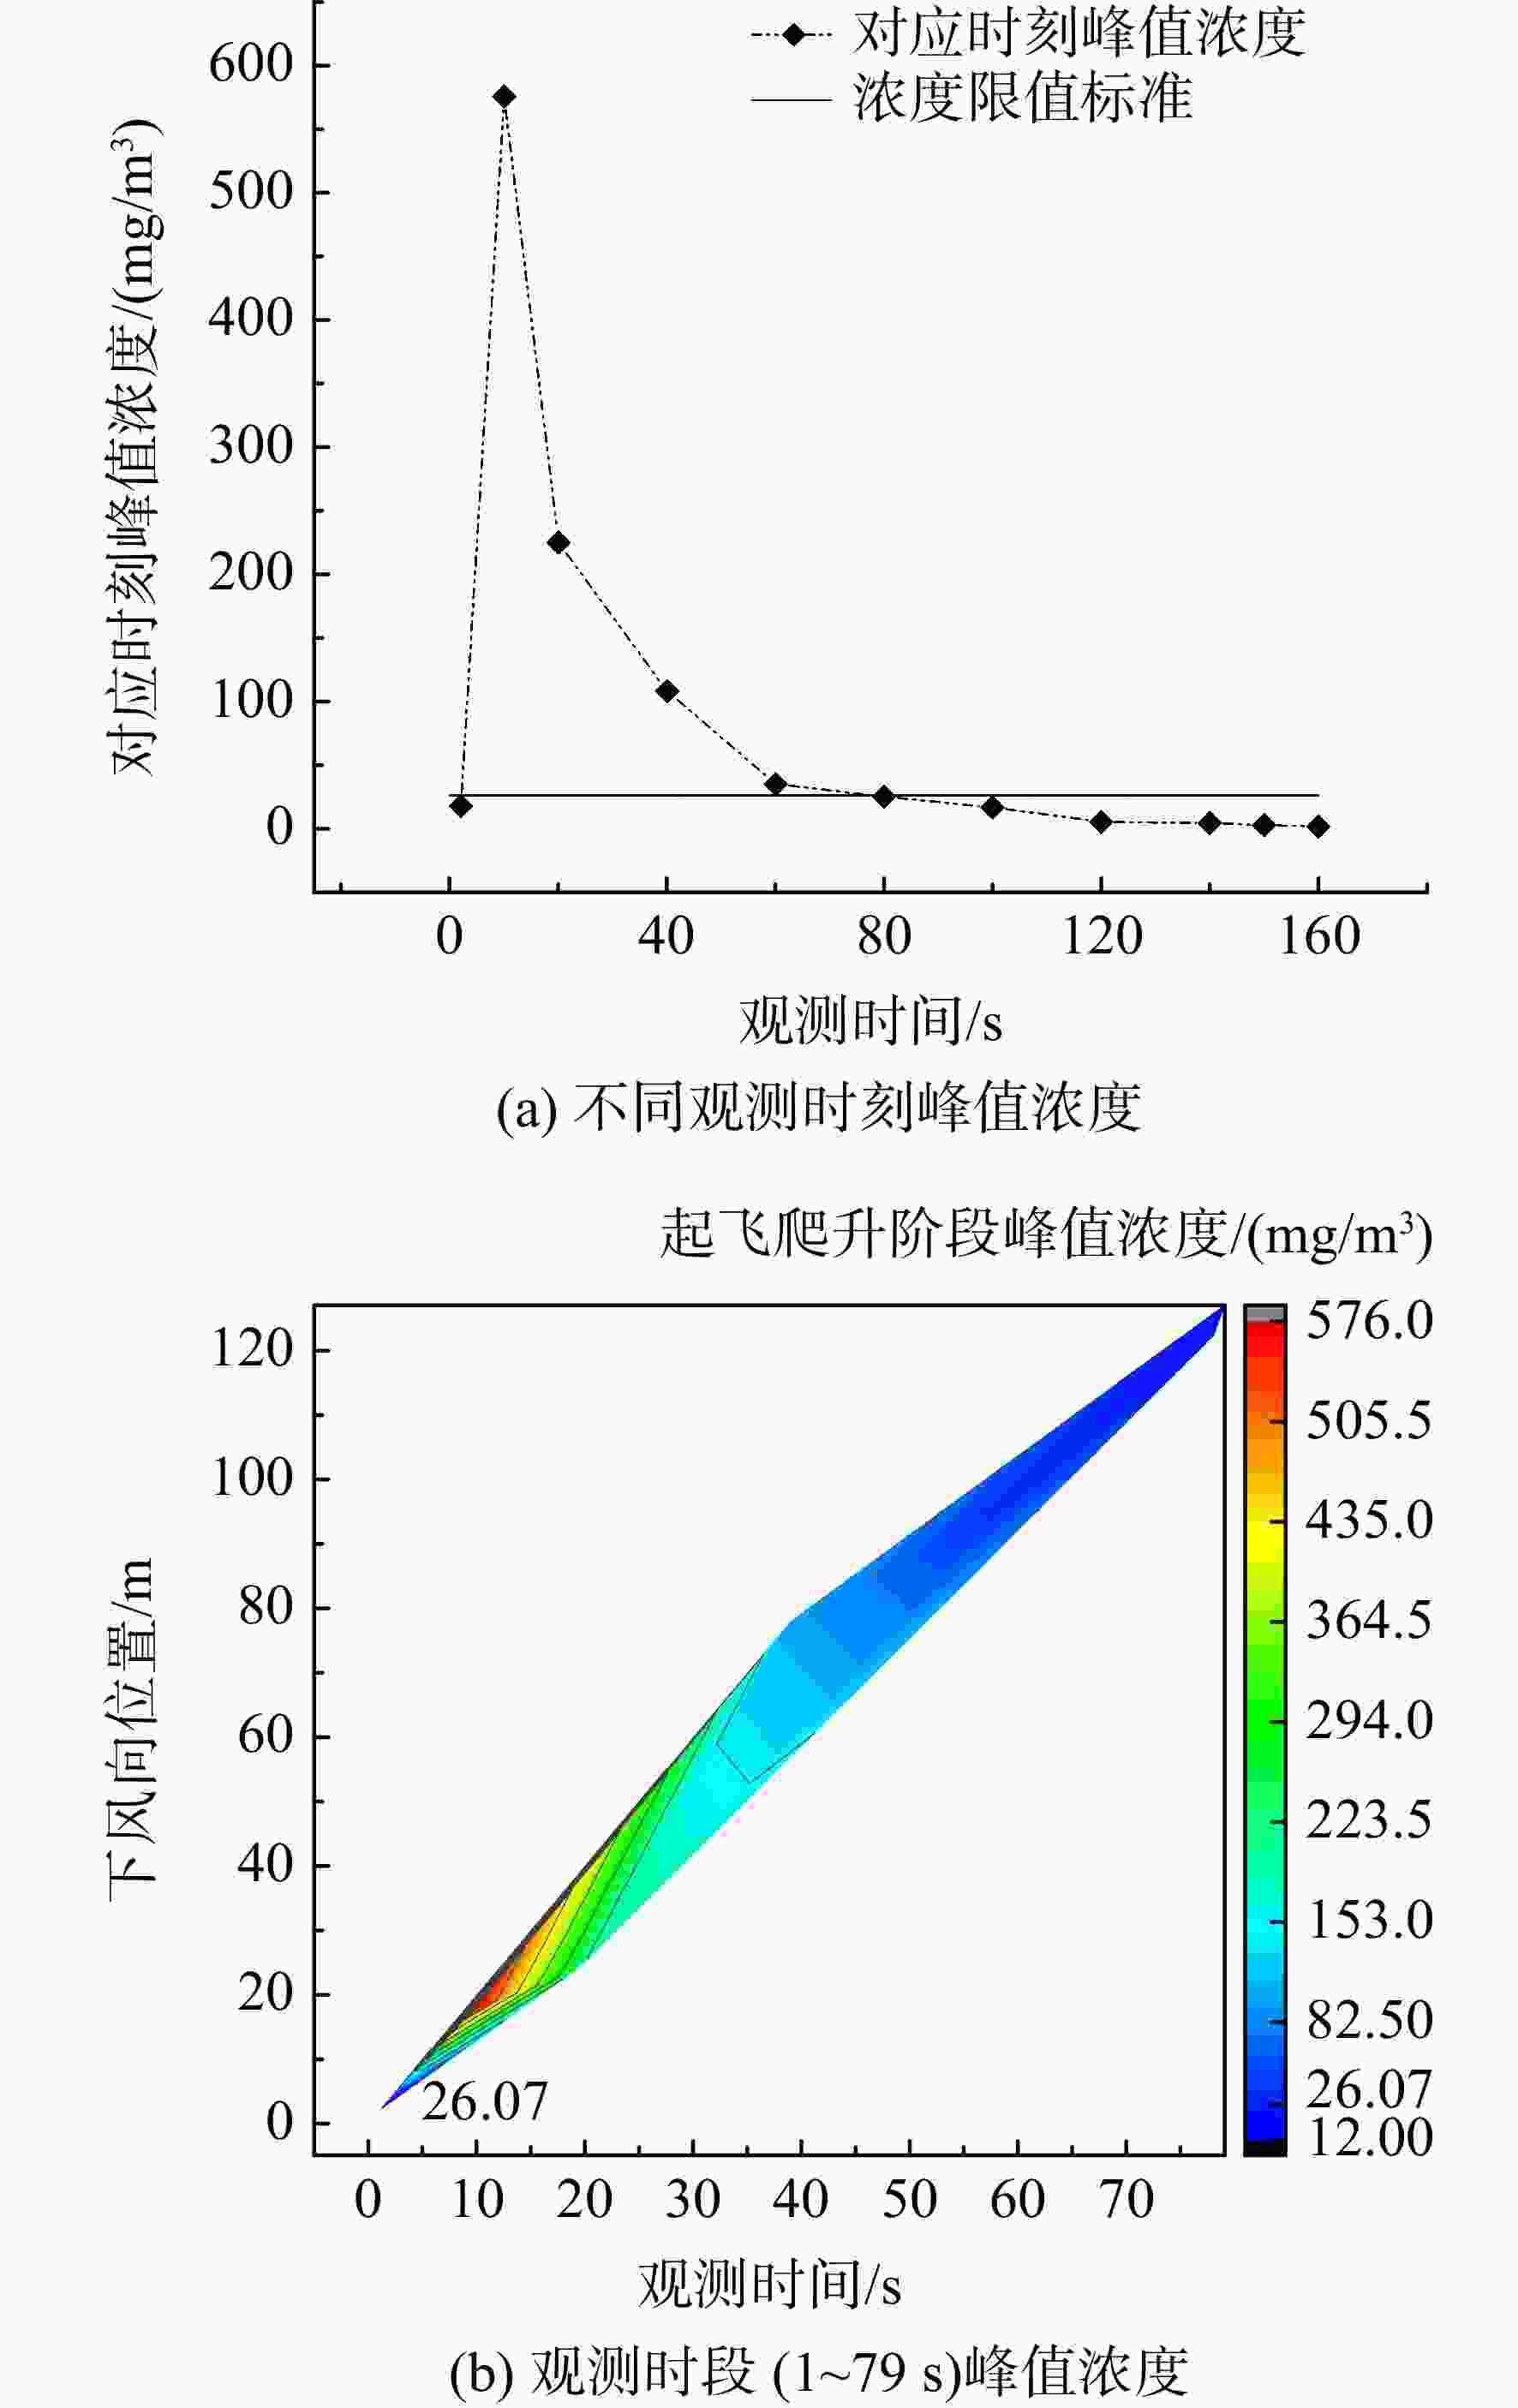
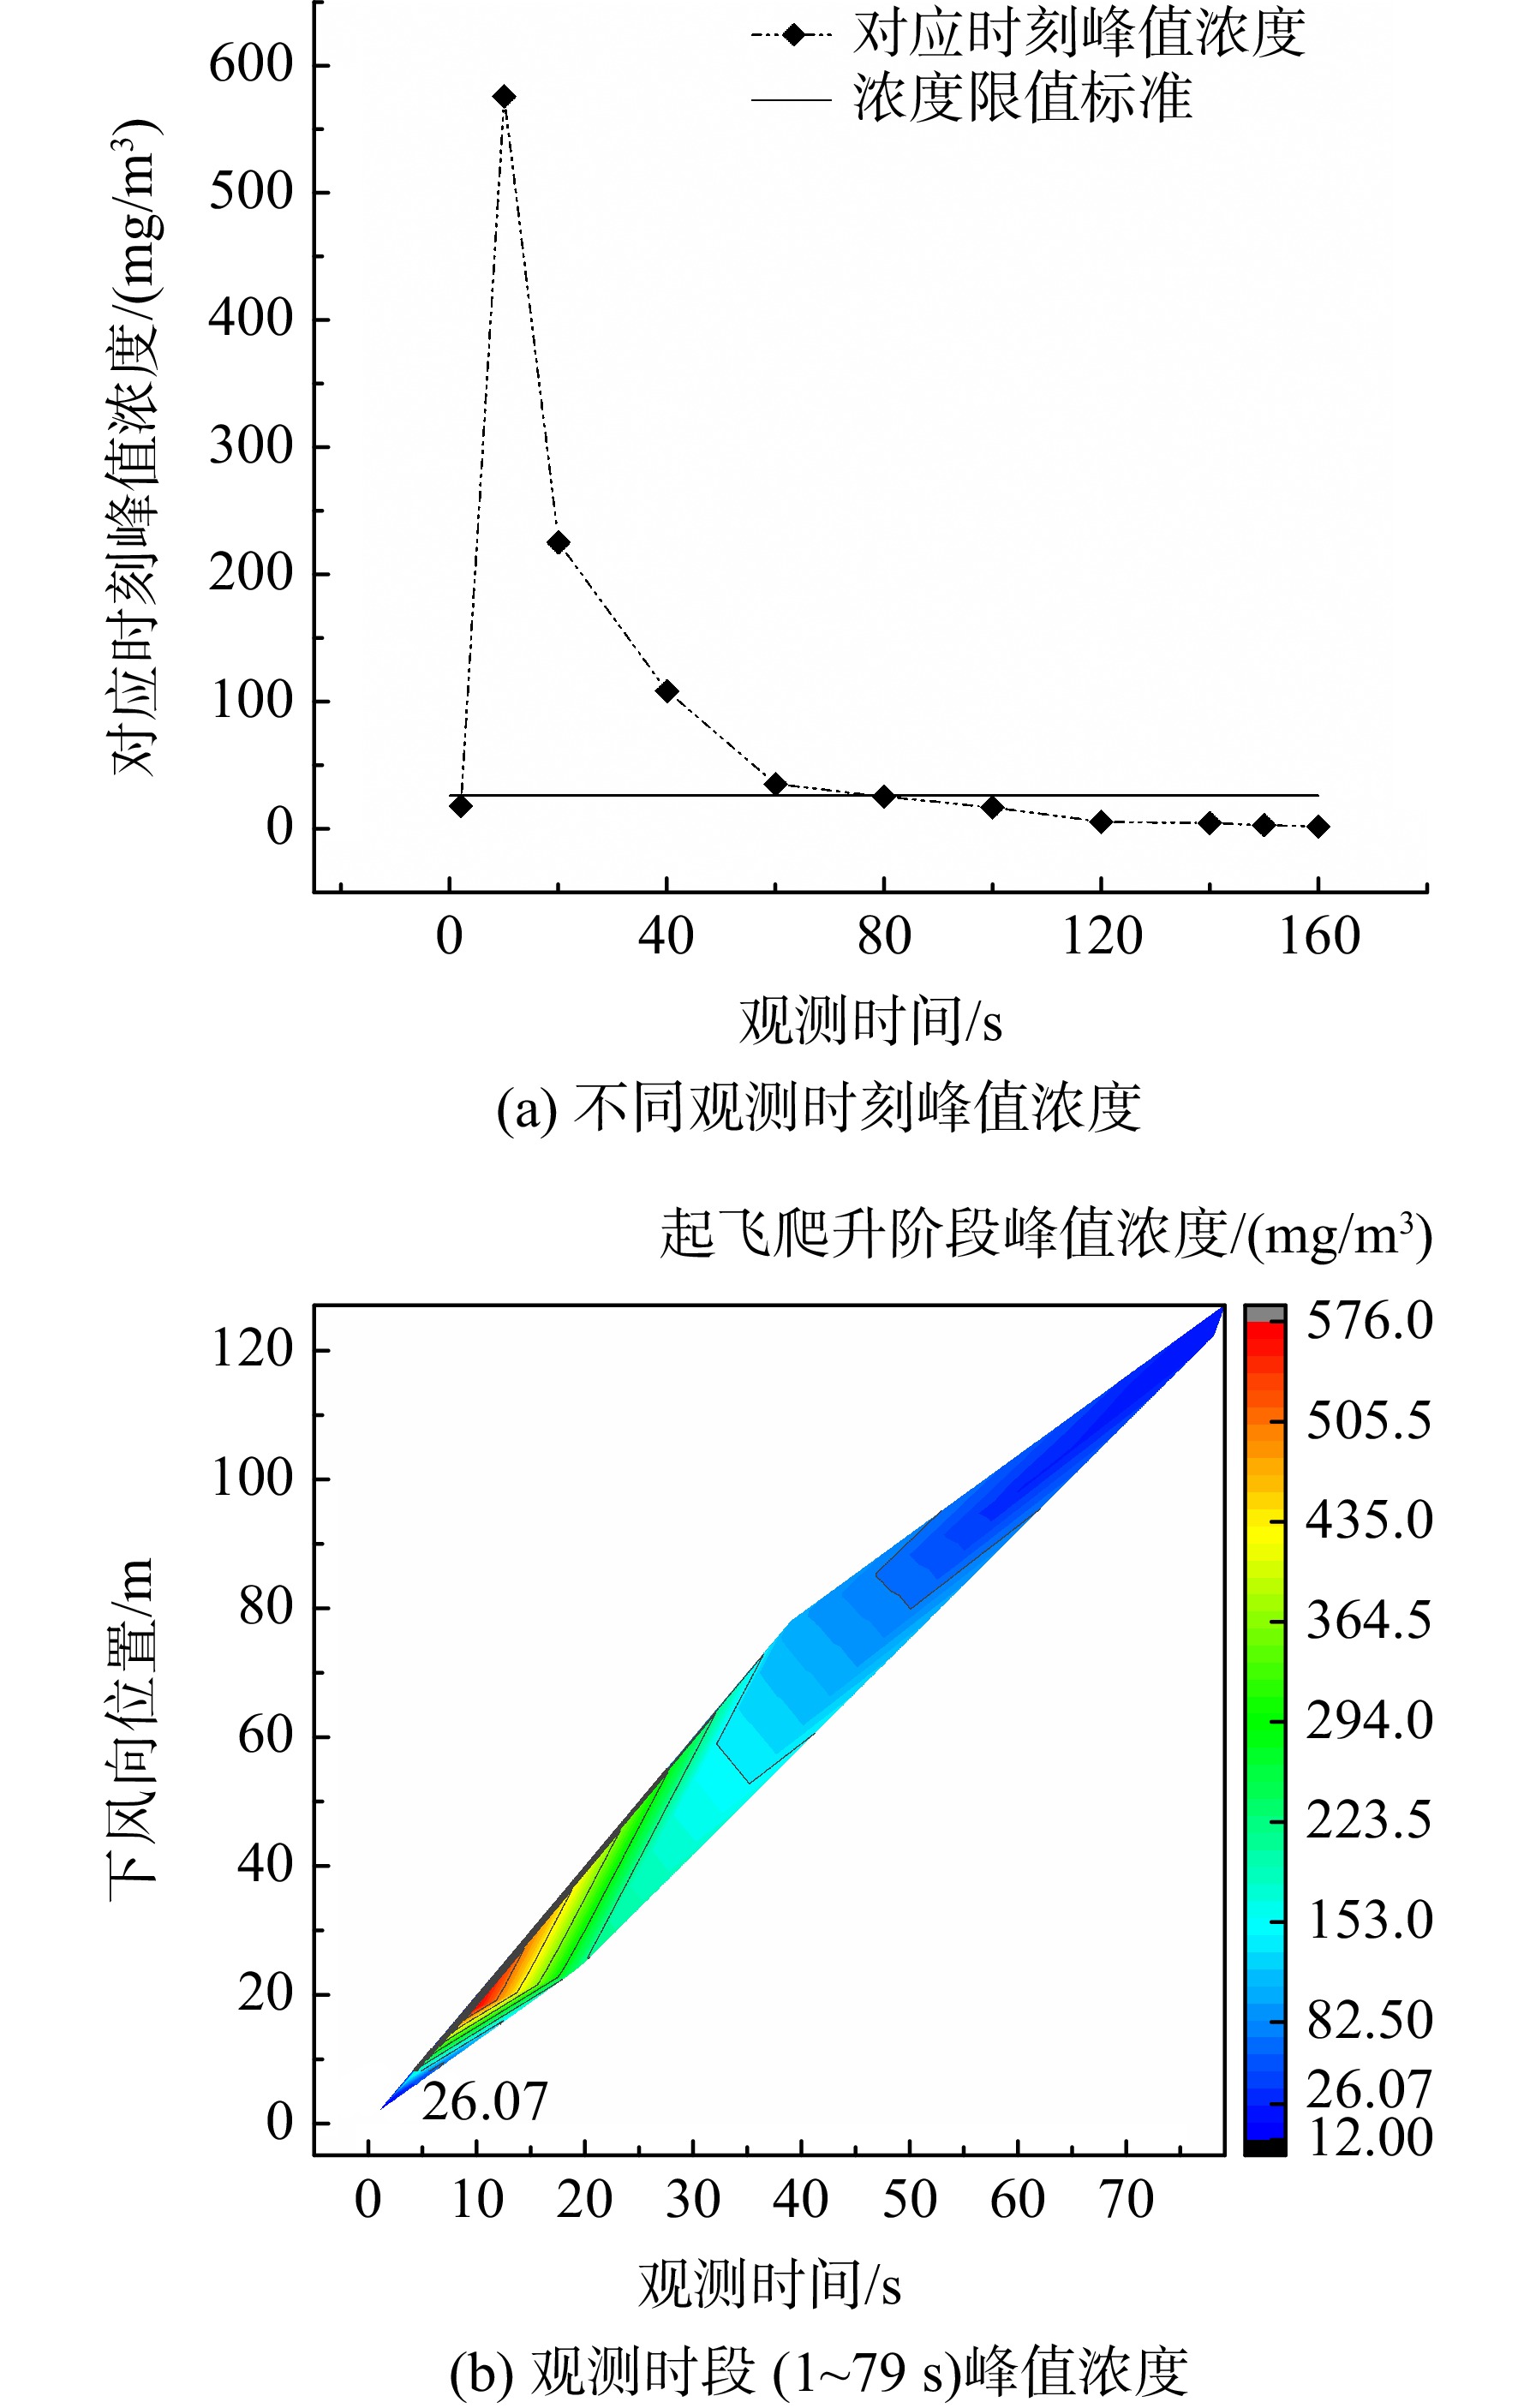
图 8 起飞爬升阶段不同观测时刻、观测时段内污染物扩散峰值浓度分布图
Figure 8. Distribution of pollutant diffusion peak concentration at different observation times and observation periods during take-off and climb
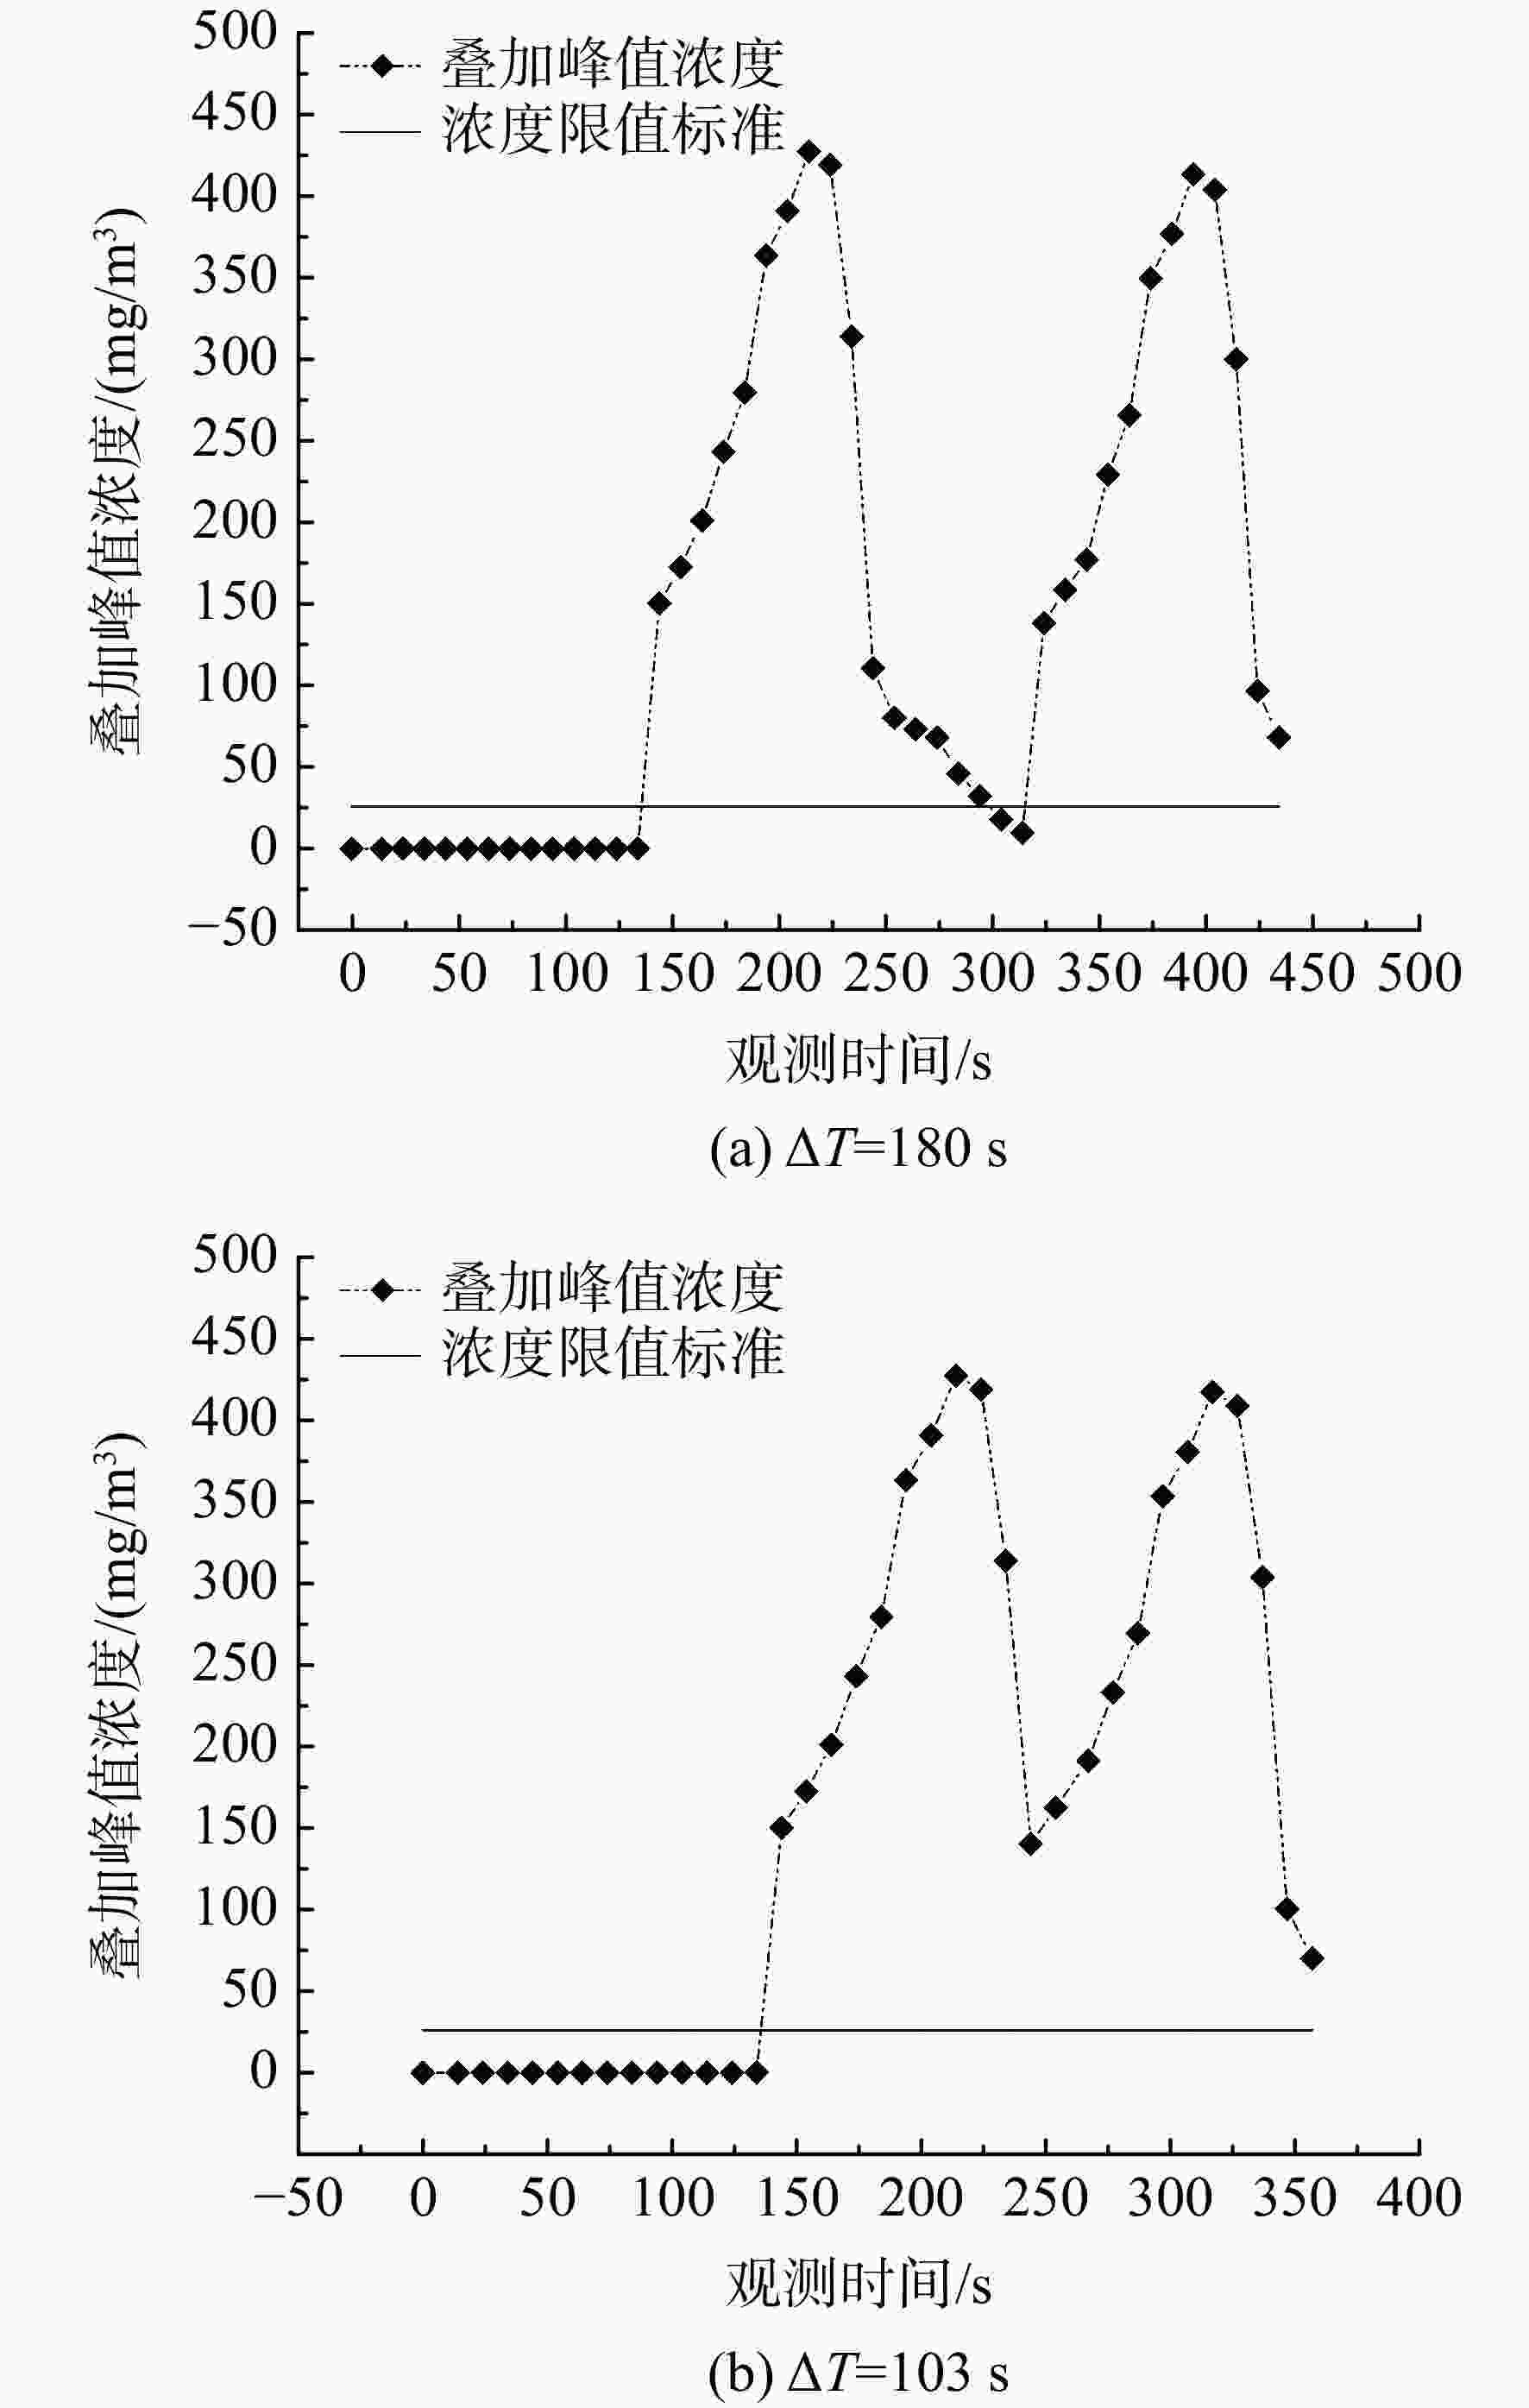
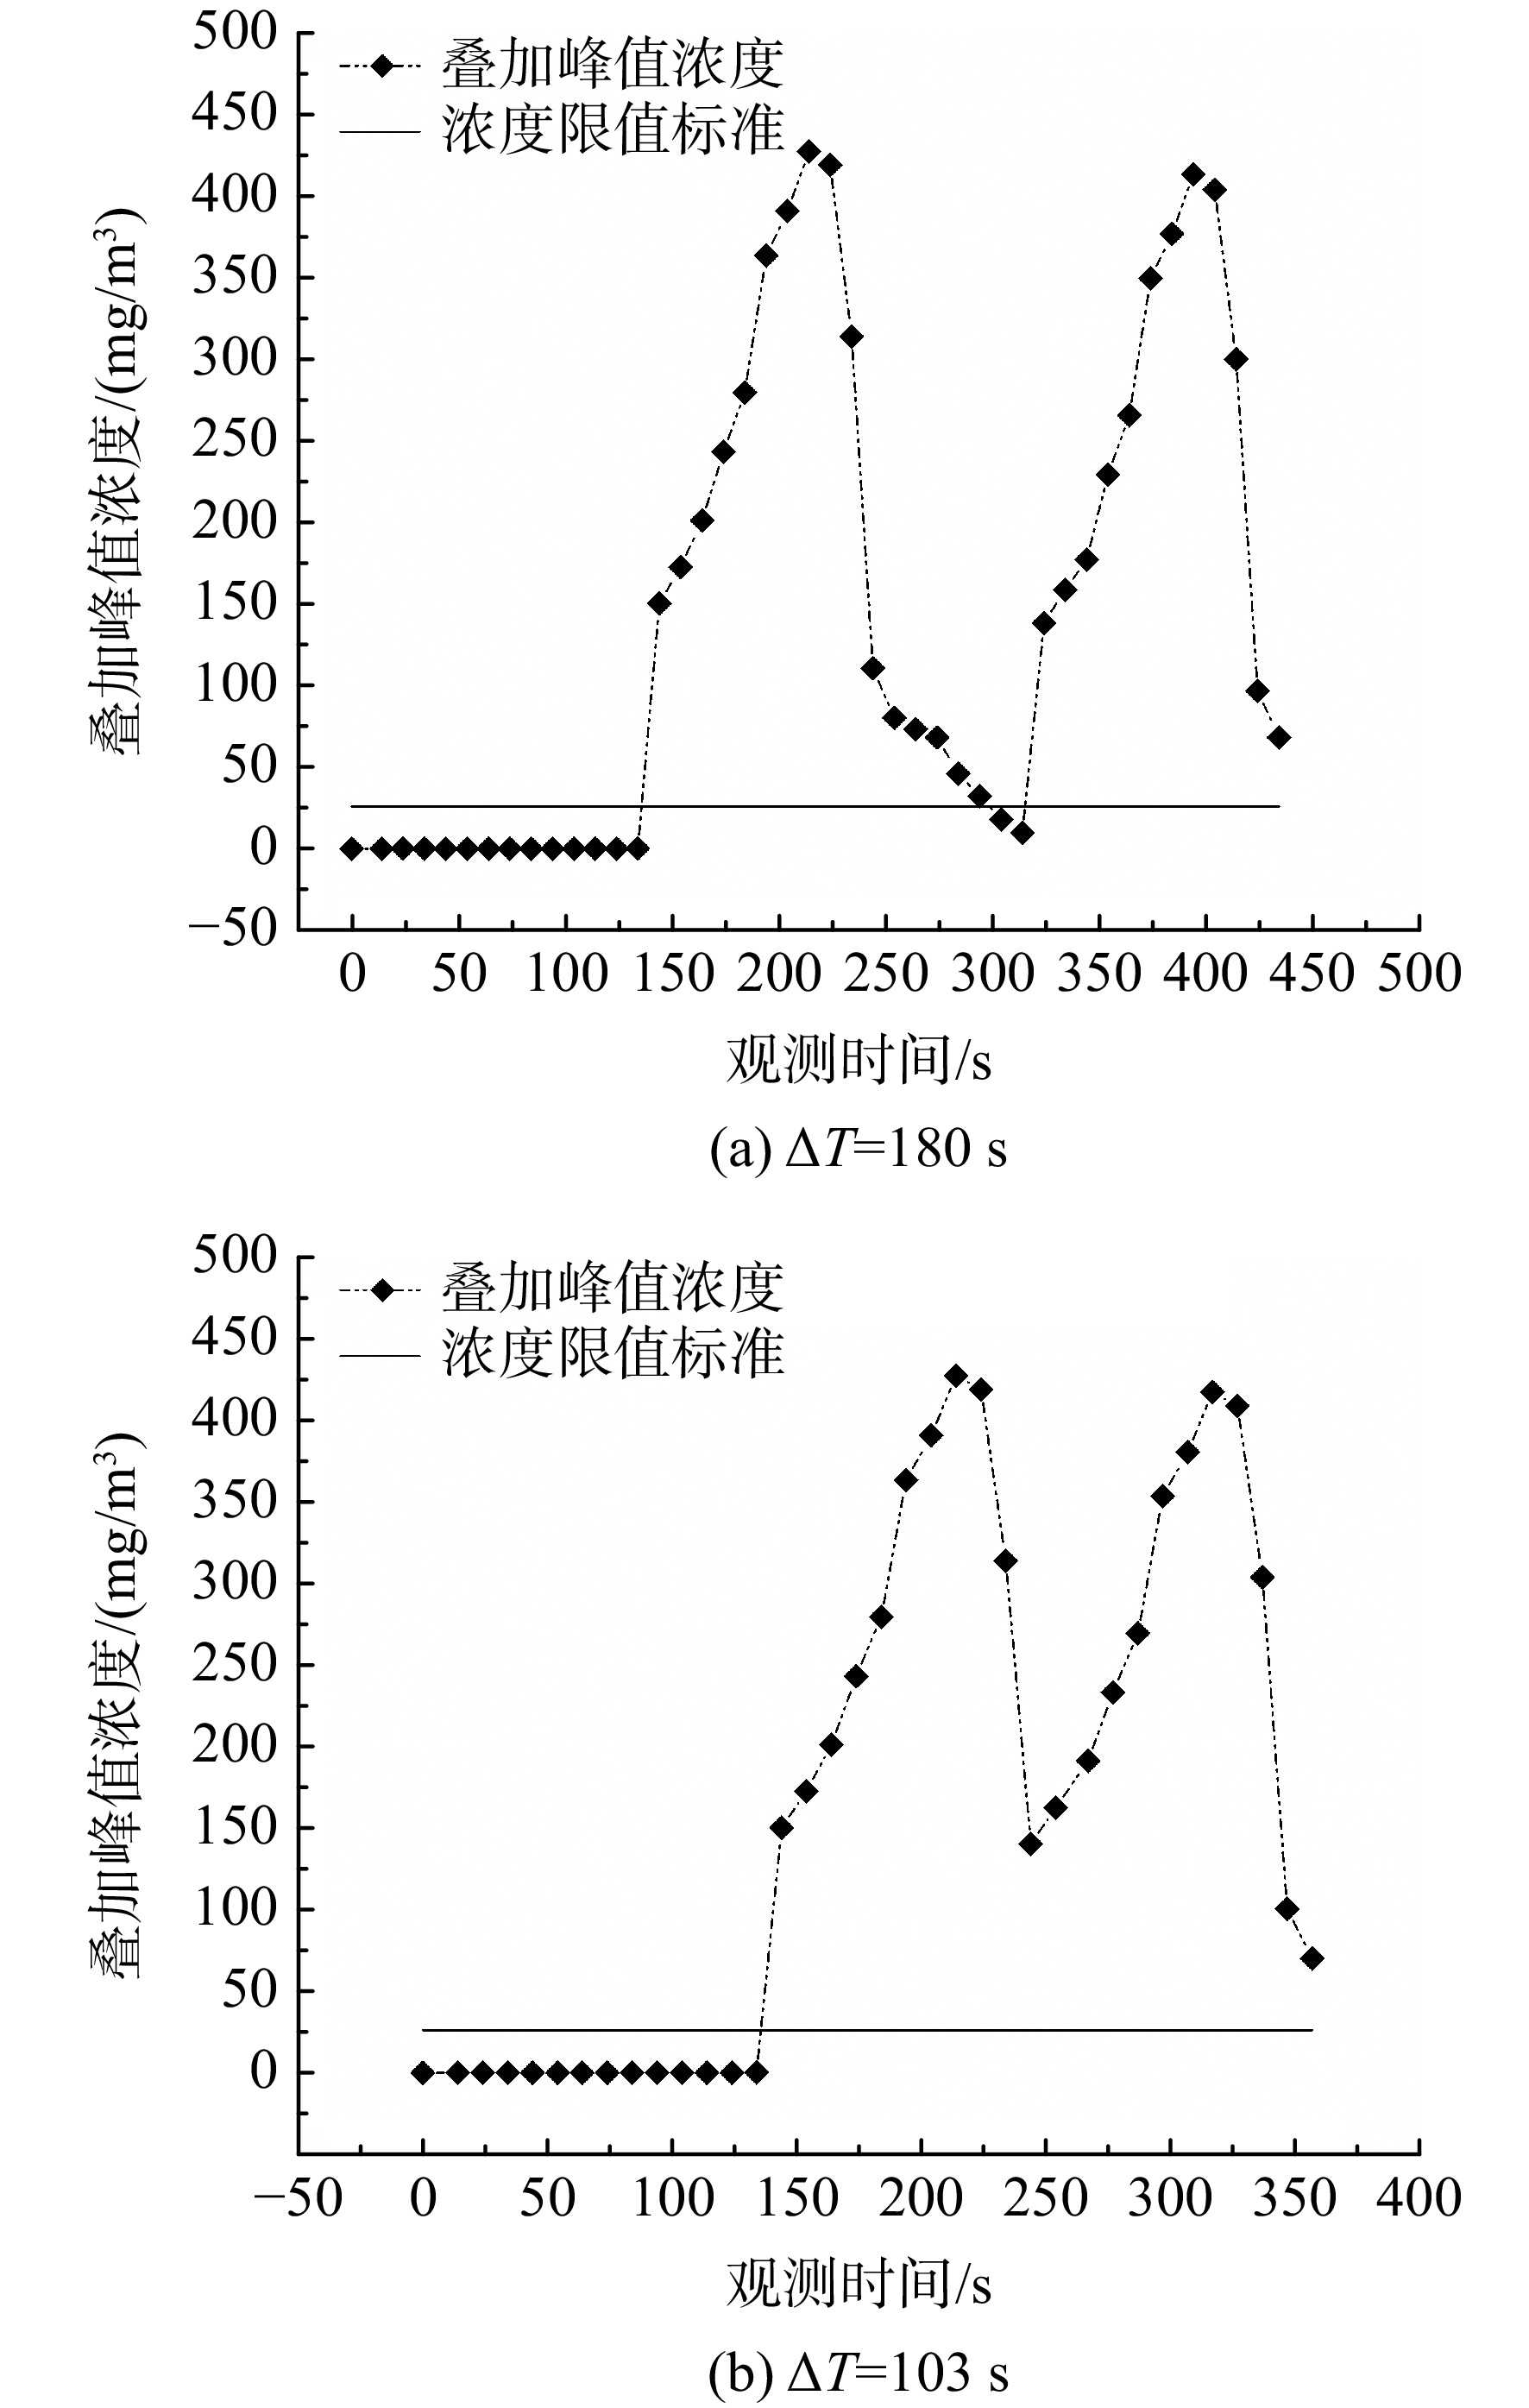
图 10 进近阶段不同间隔时间下污染物叠加扩散峰值浓度分布图
Figure 10. Distribution of peak concentration of pollutants superimposed diffusion at different intervals during approach phase
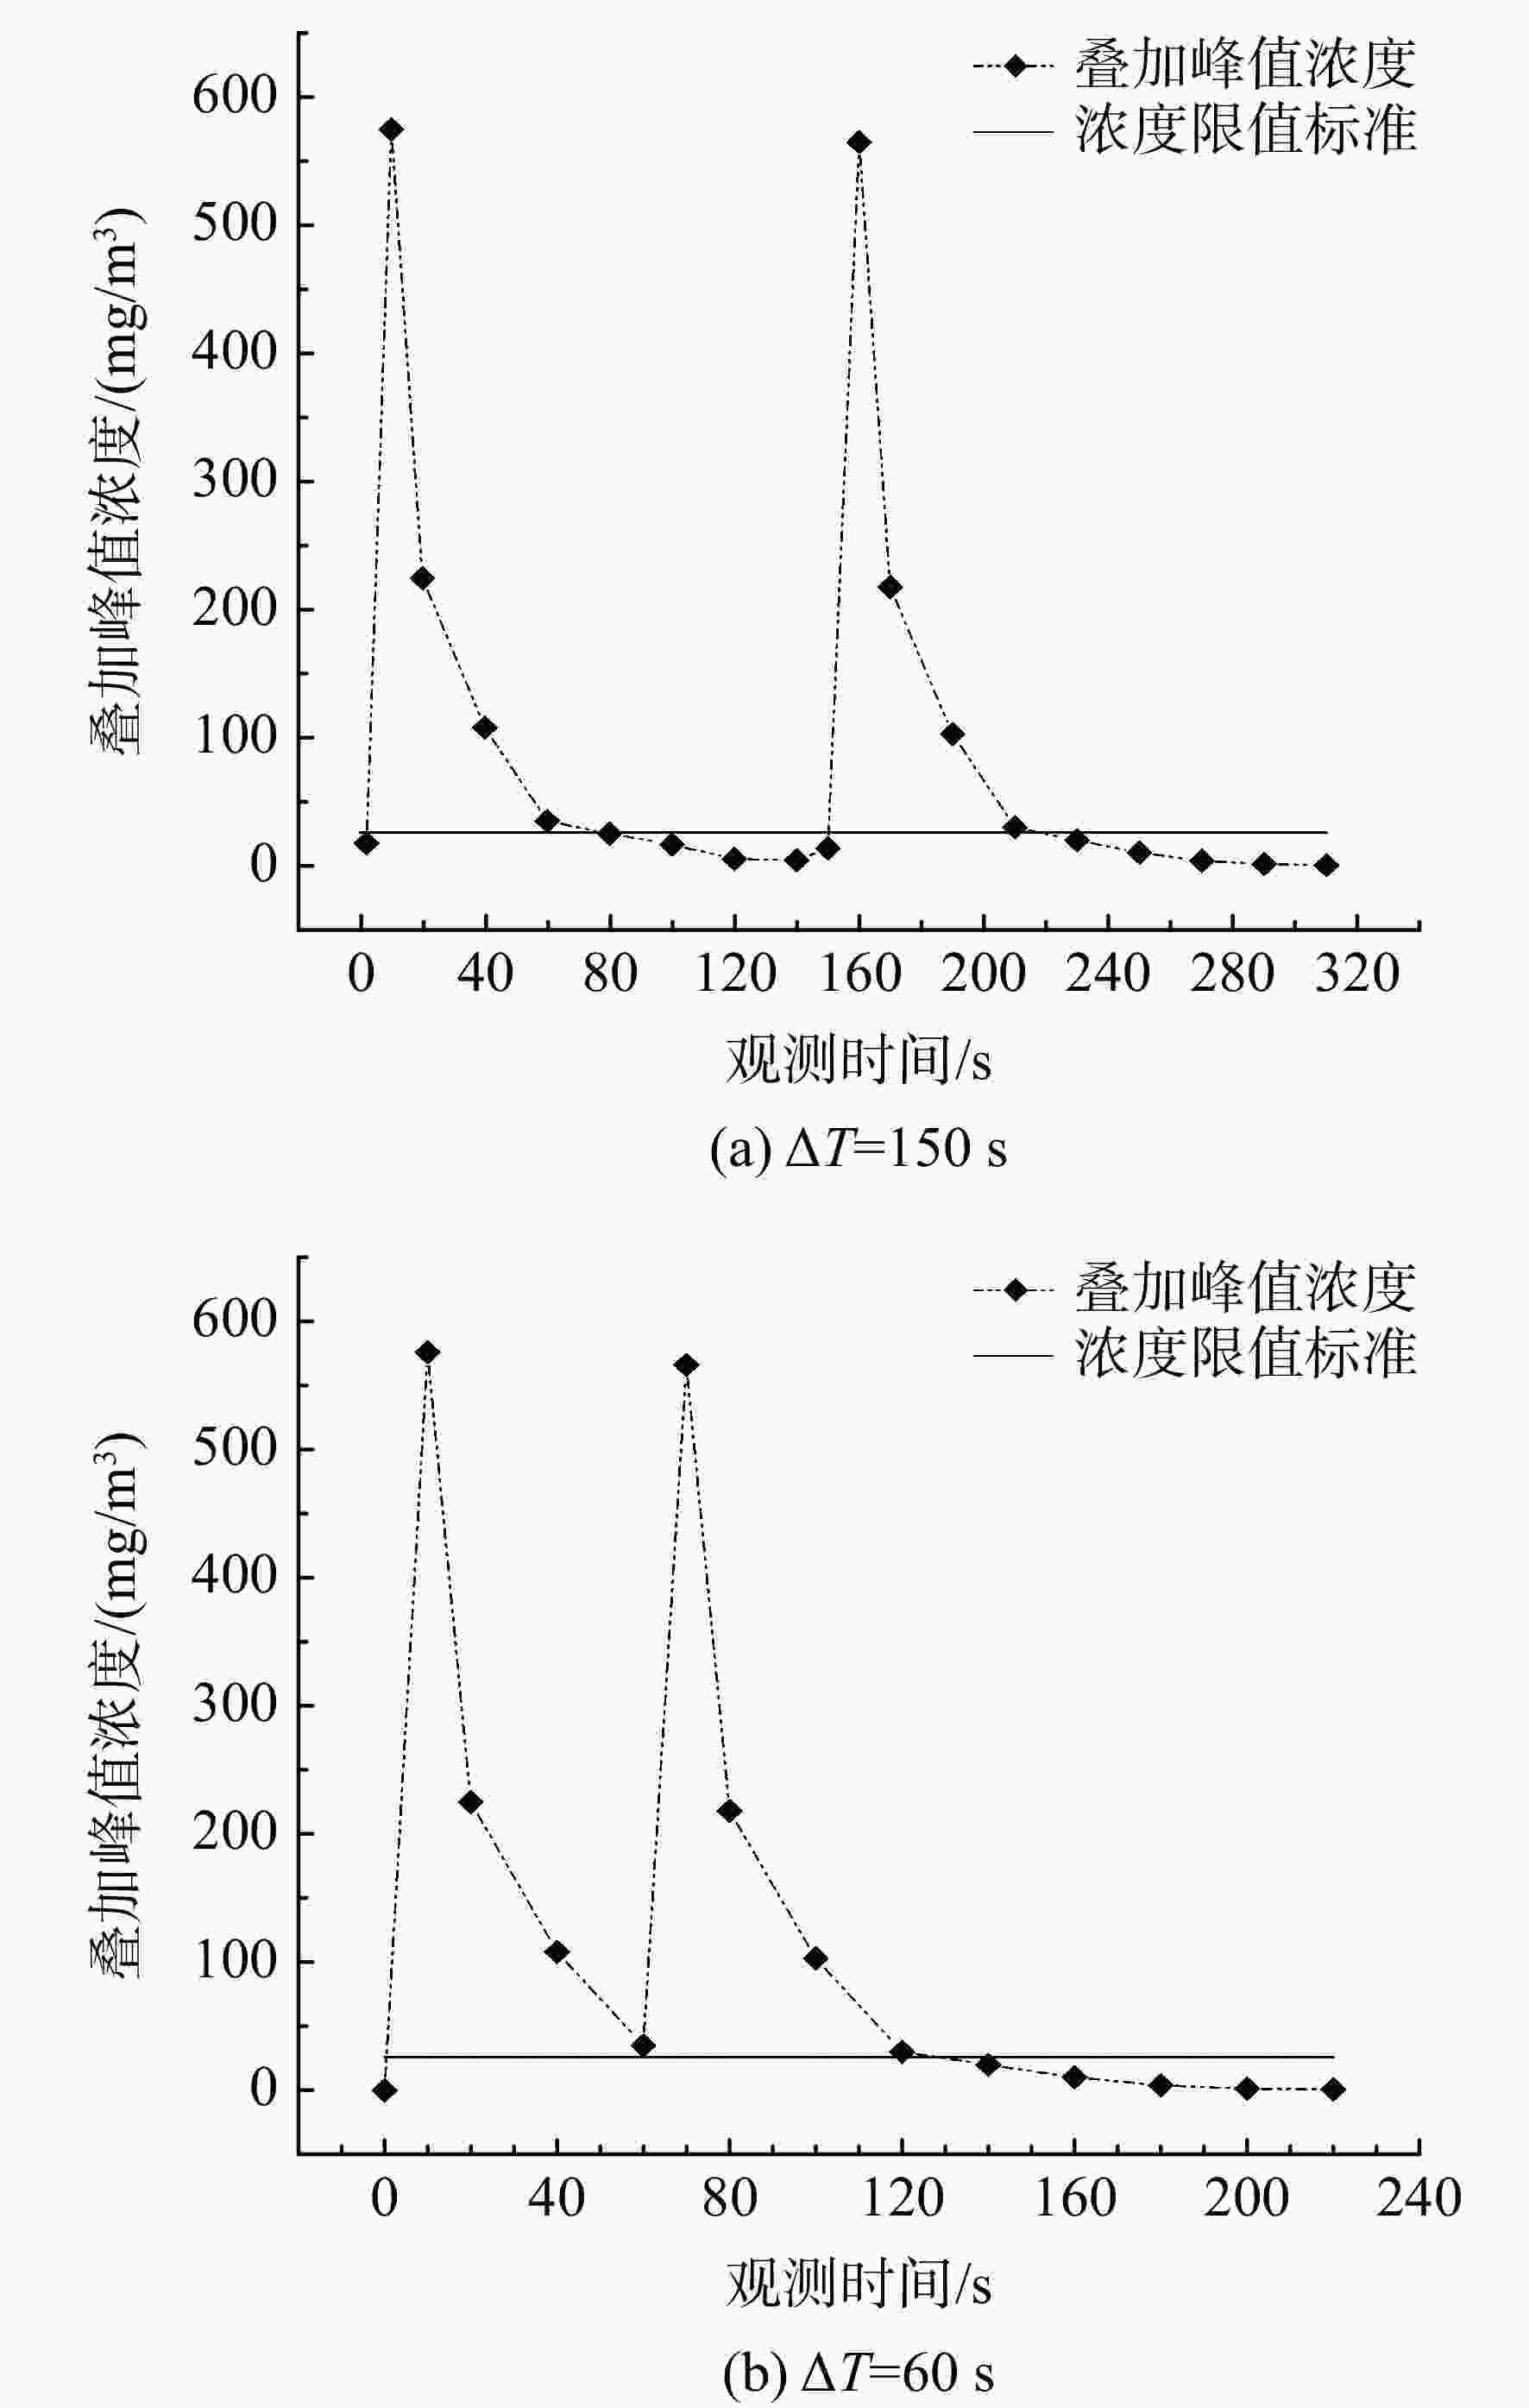
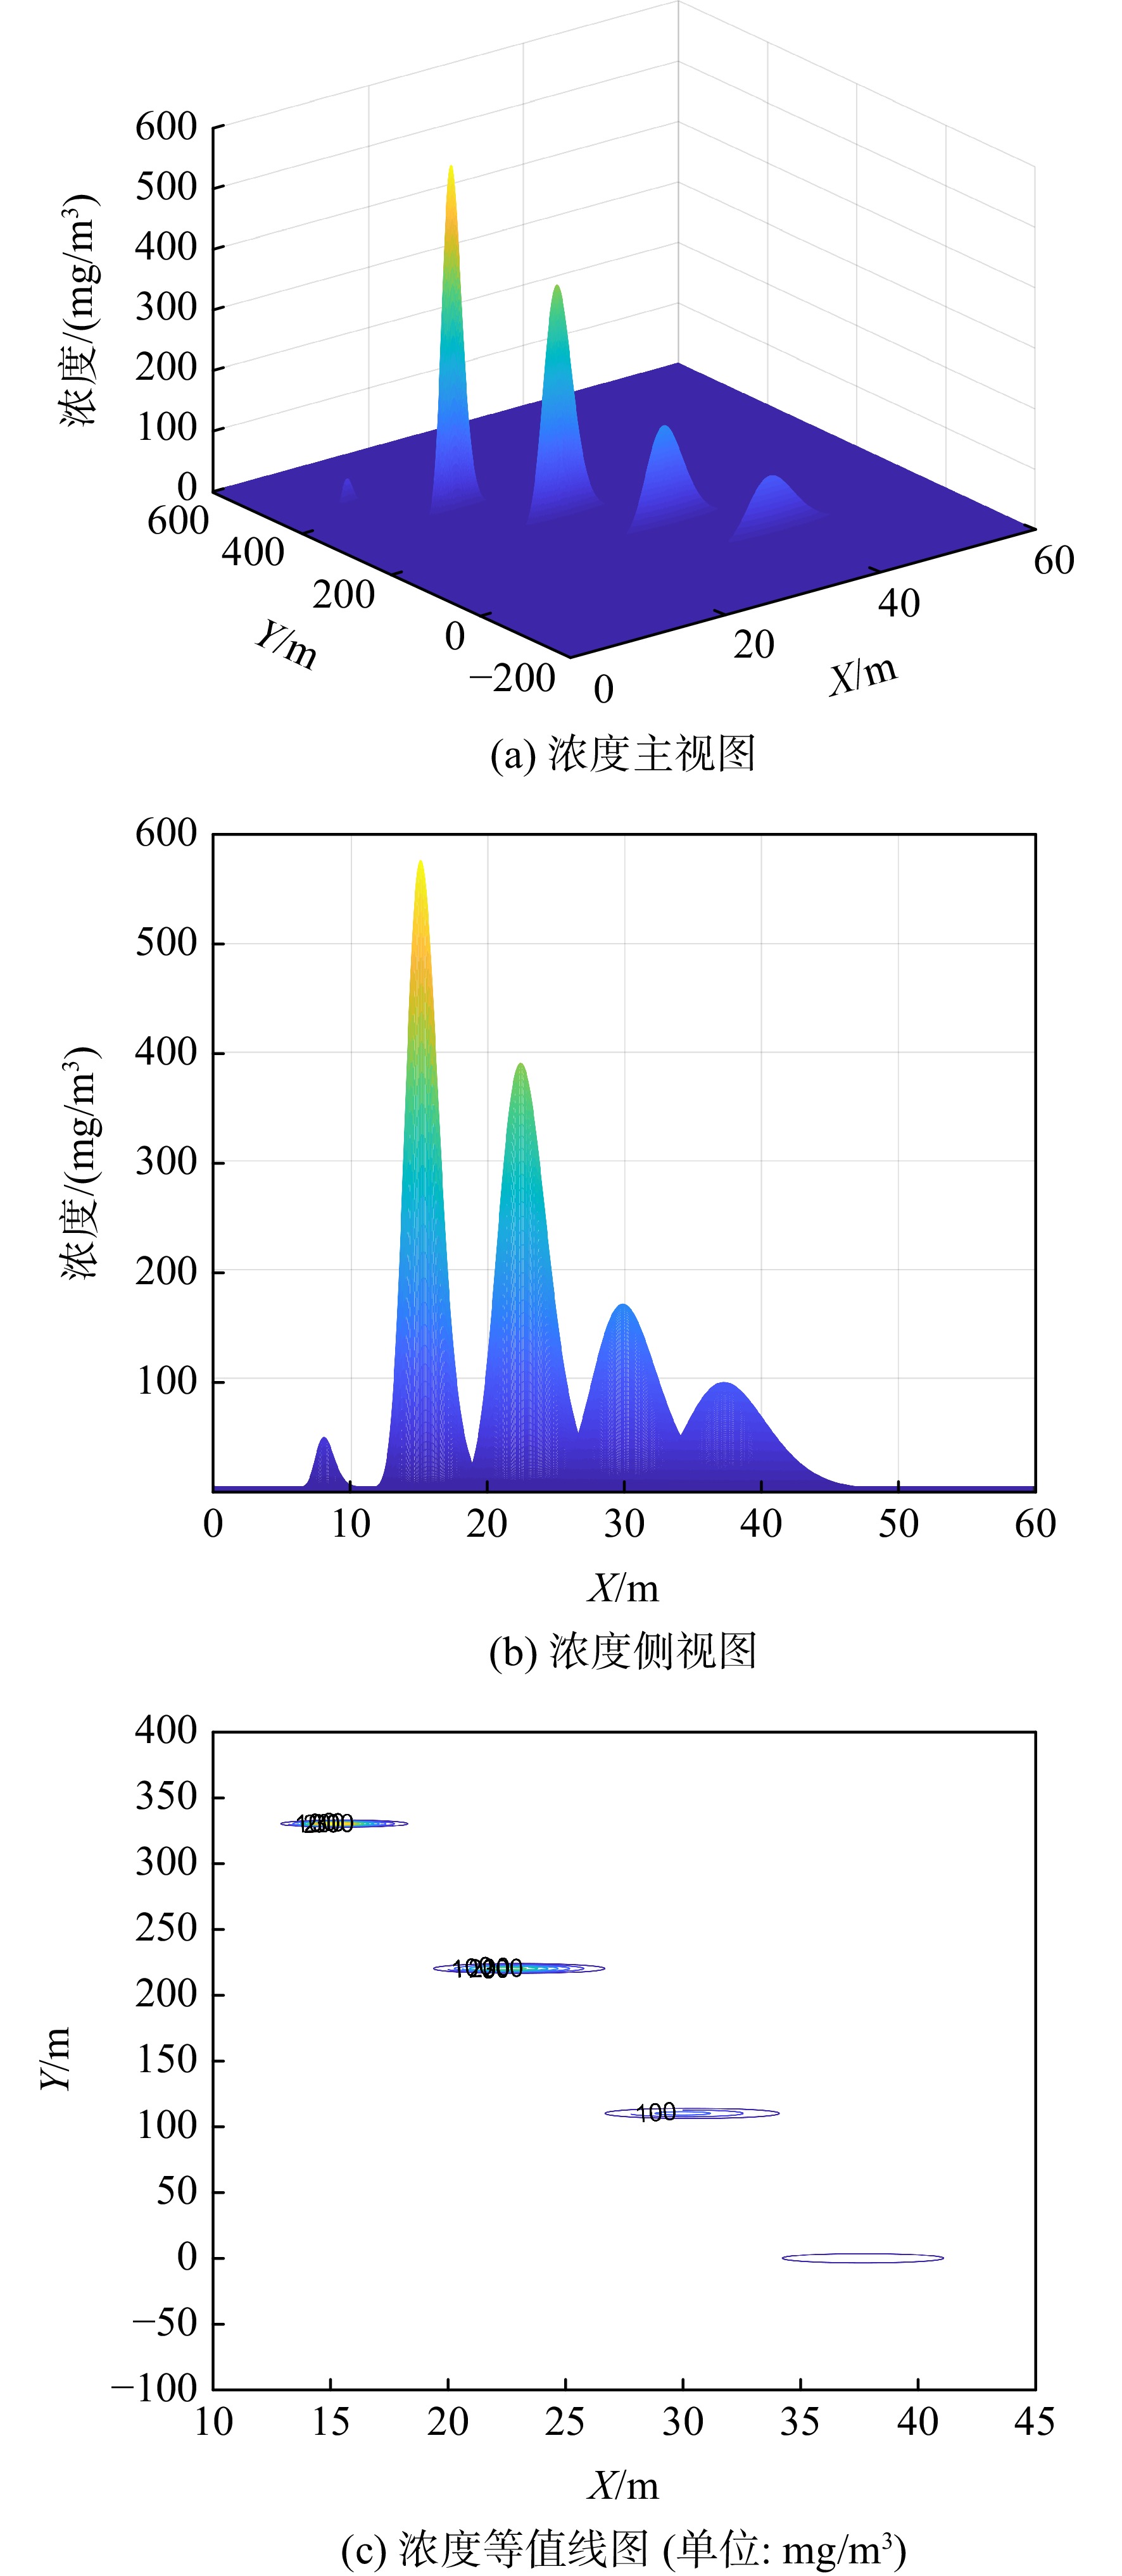
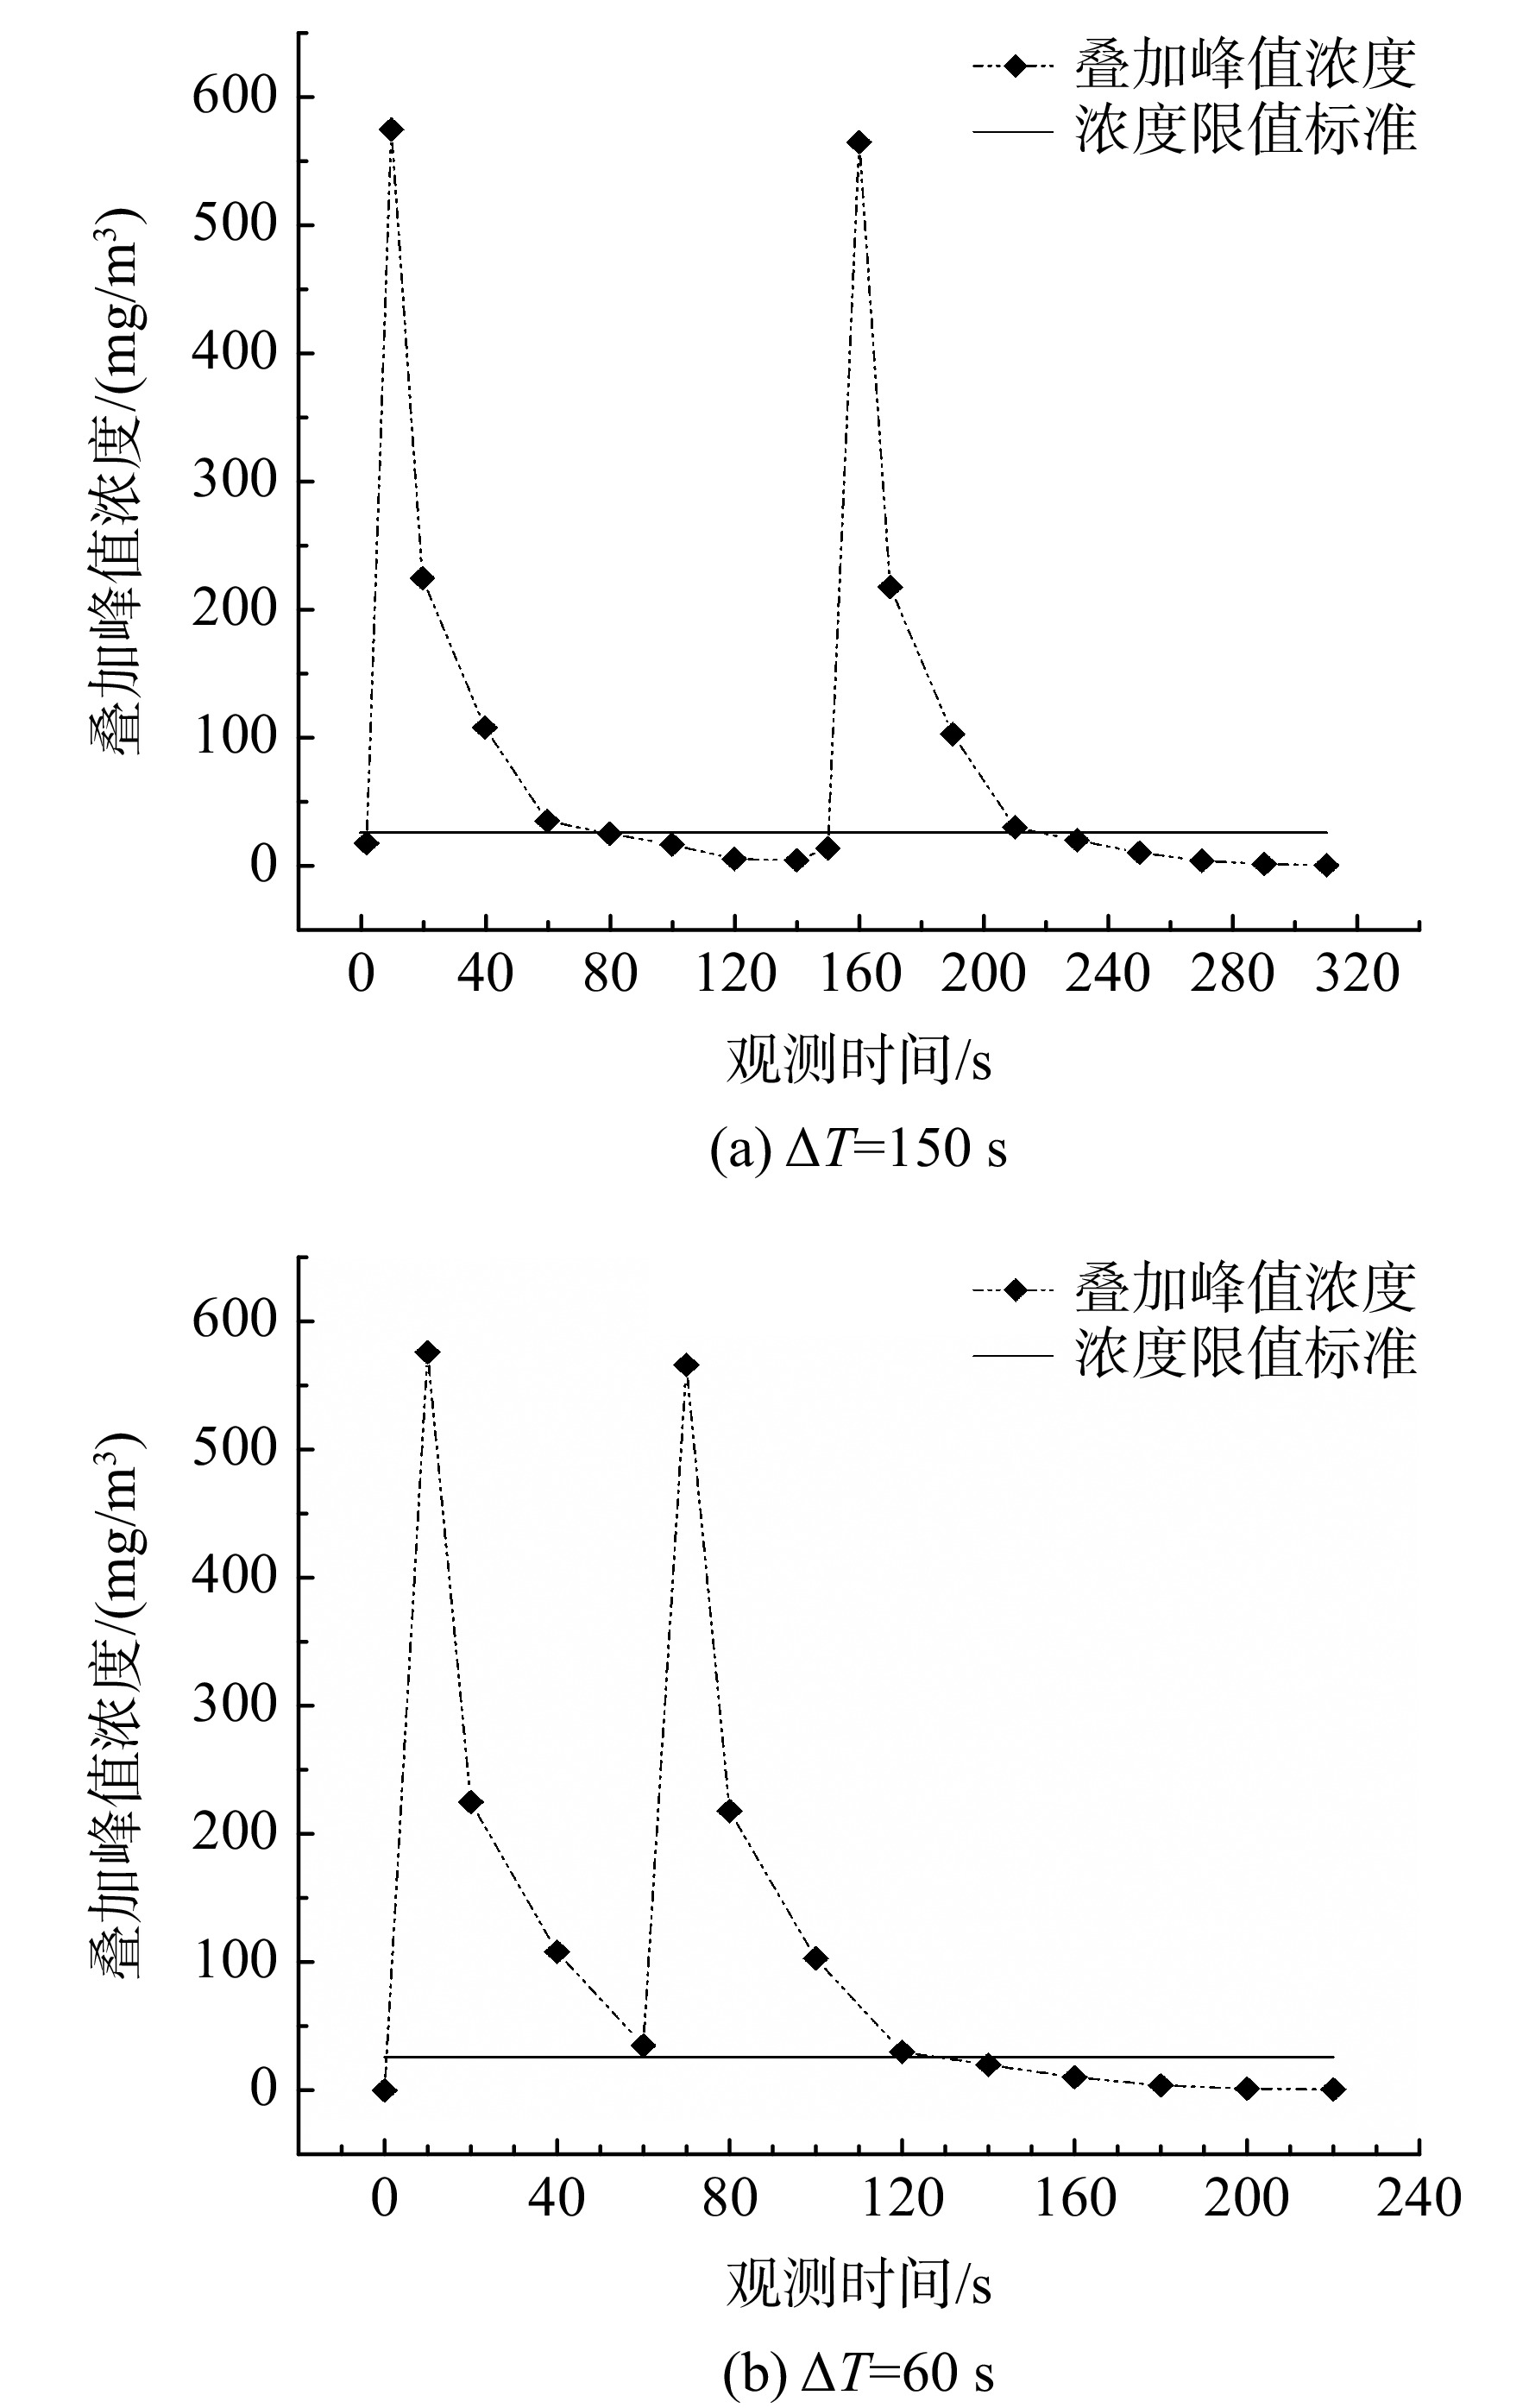
图 11 起飞爬升阶段不同间隔时间下污染物叠加扩散峰值浓度分布图
Figure 11. Distribution of peak concentration of pollutants superimposed diffusion at different intervals during take-off and climb phase
表 1 GE90-115B型发动机基准参数
Table 1. GE90-115B engine benchmark parameters
飞行阶段 推力等级/% 燃油流量/(kg/s) 空燃比ARF 发烟指数SN 气态污染物基准排放指数/(g/kg) NOx HC CO SO2 起飞 100 4.69 45 4.10 50.34 0.04 0.08 3.87 爬升 85 3.67 51 2.50 35.98 0.03 0.07 3.87 进近 30 1.13 83 1.45 16.50 0.06 1.98 3.87 滑行 7 0.38 106 0.87 5.19 4.24 39.11 3.87  下载: 导出CSV
表 2 PW4077D型发动机基准参数
Table 2. Benchmark parameters of PW4077D engine
飞行阶段 推力等级/% 燃油流量/(kg/s) 空燃比ARF 发烟指数SN 气态污染物基准排放指数/(g/kg) NOx HC CO 起飞 100 3.172 45 4.9 44.68 0.02 0.29 爬升 85 2.562 51 2.57 34.05 0.02 0.34 进近 30 0.892 83 0.66 11.63 0.04 0.86 滑行 7 0.310 106 0.34 3.81 2.82 24.8 注:SO2受GB6537-2006规定,按照航空煤油中含硫量最大限值0.2%,作为燃油含硫量数据,假定硫组分经过完全燃烧之后,96.7%转化为SO2进行计算[25]。
下载: 导出CSV
表 3 污染物浓度限值
Table 3. Pollutant concentration limits
序号 污染物种类 平均时间 浓度限制(二级) 1 SO2/(μg/m3) 1小时平均 500 日平均 150 2 NOx/(μg/m3) 1小时平均 250 日平均 100 3 CO/(mg/m3) 1小时平均 10 日平均 4 4 HC/(mg/m3) 1小时平均 15 日平均 6 5 PM2.5/(μg/m3) 1小时平均 200 日平均 75 总和/(mg/m3) 1小时平均 25.95 日平均 10.325 注:HC的1小时平均浓度限值和日平均浓度限值及PM2.5的1小时平均限值在文件中并未给出,本文根据浓度限值设定方法等比例估算其数值;由于不同种类污染物是同时排出,互相掺杂,故而本文在根据浓度限值进行研究时,选定的浓度限值为5种污染物浓度限值总和。
下载: 导出CSV
表 4 GE90-115B、PW4077D型发动机LTO循环各阶段特征参数
Table 4. Characteristic parameters of each stage of the LTO cycle of GE90-115B and PW4077D engines
飞行阶段 推力设置/% 工作时间/s 燃油流量/(kg/s) GE90-115B PW4077D GE90-115B PW4077D GE90-115B PW4077D 起飞 23~104 22~103 54 61 3.576~4.862 3.458~4.762 爬升 93~105 91~105 106 112 3.157~4.596 3.043~4.496 进近 27~68 26~67 324 295 0.697~1.853 0.627~1.803 滑行 7~22 7~25 1918 1606 0.296~0.465 0.252~0.475
下载: 导出CSV
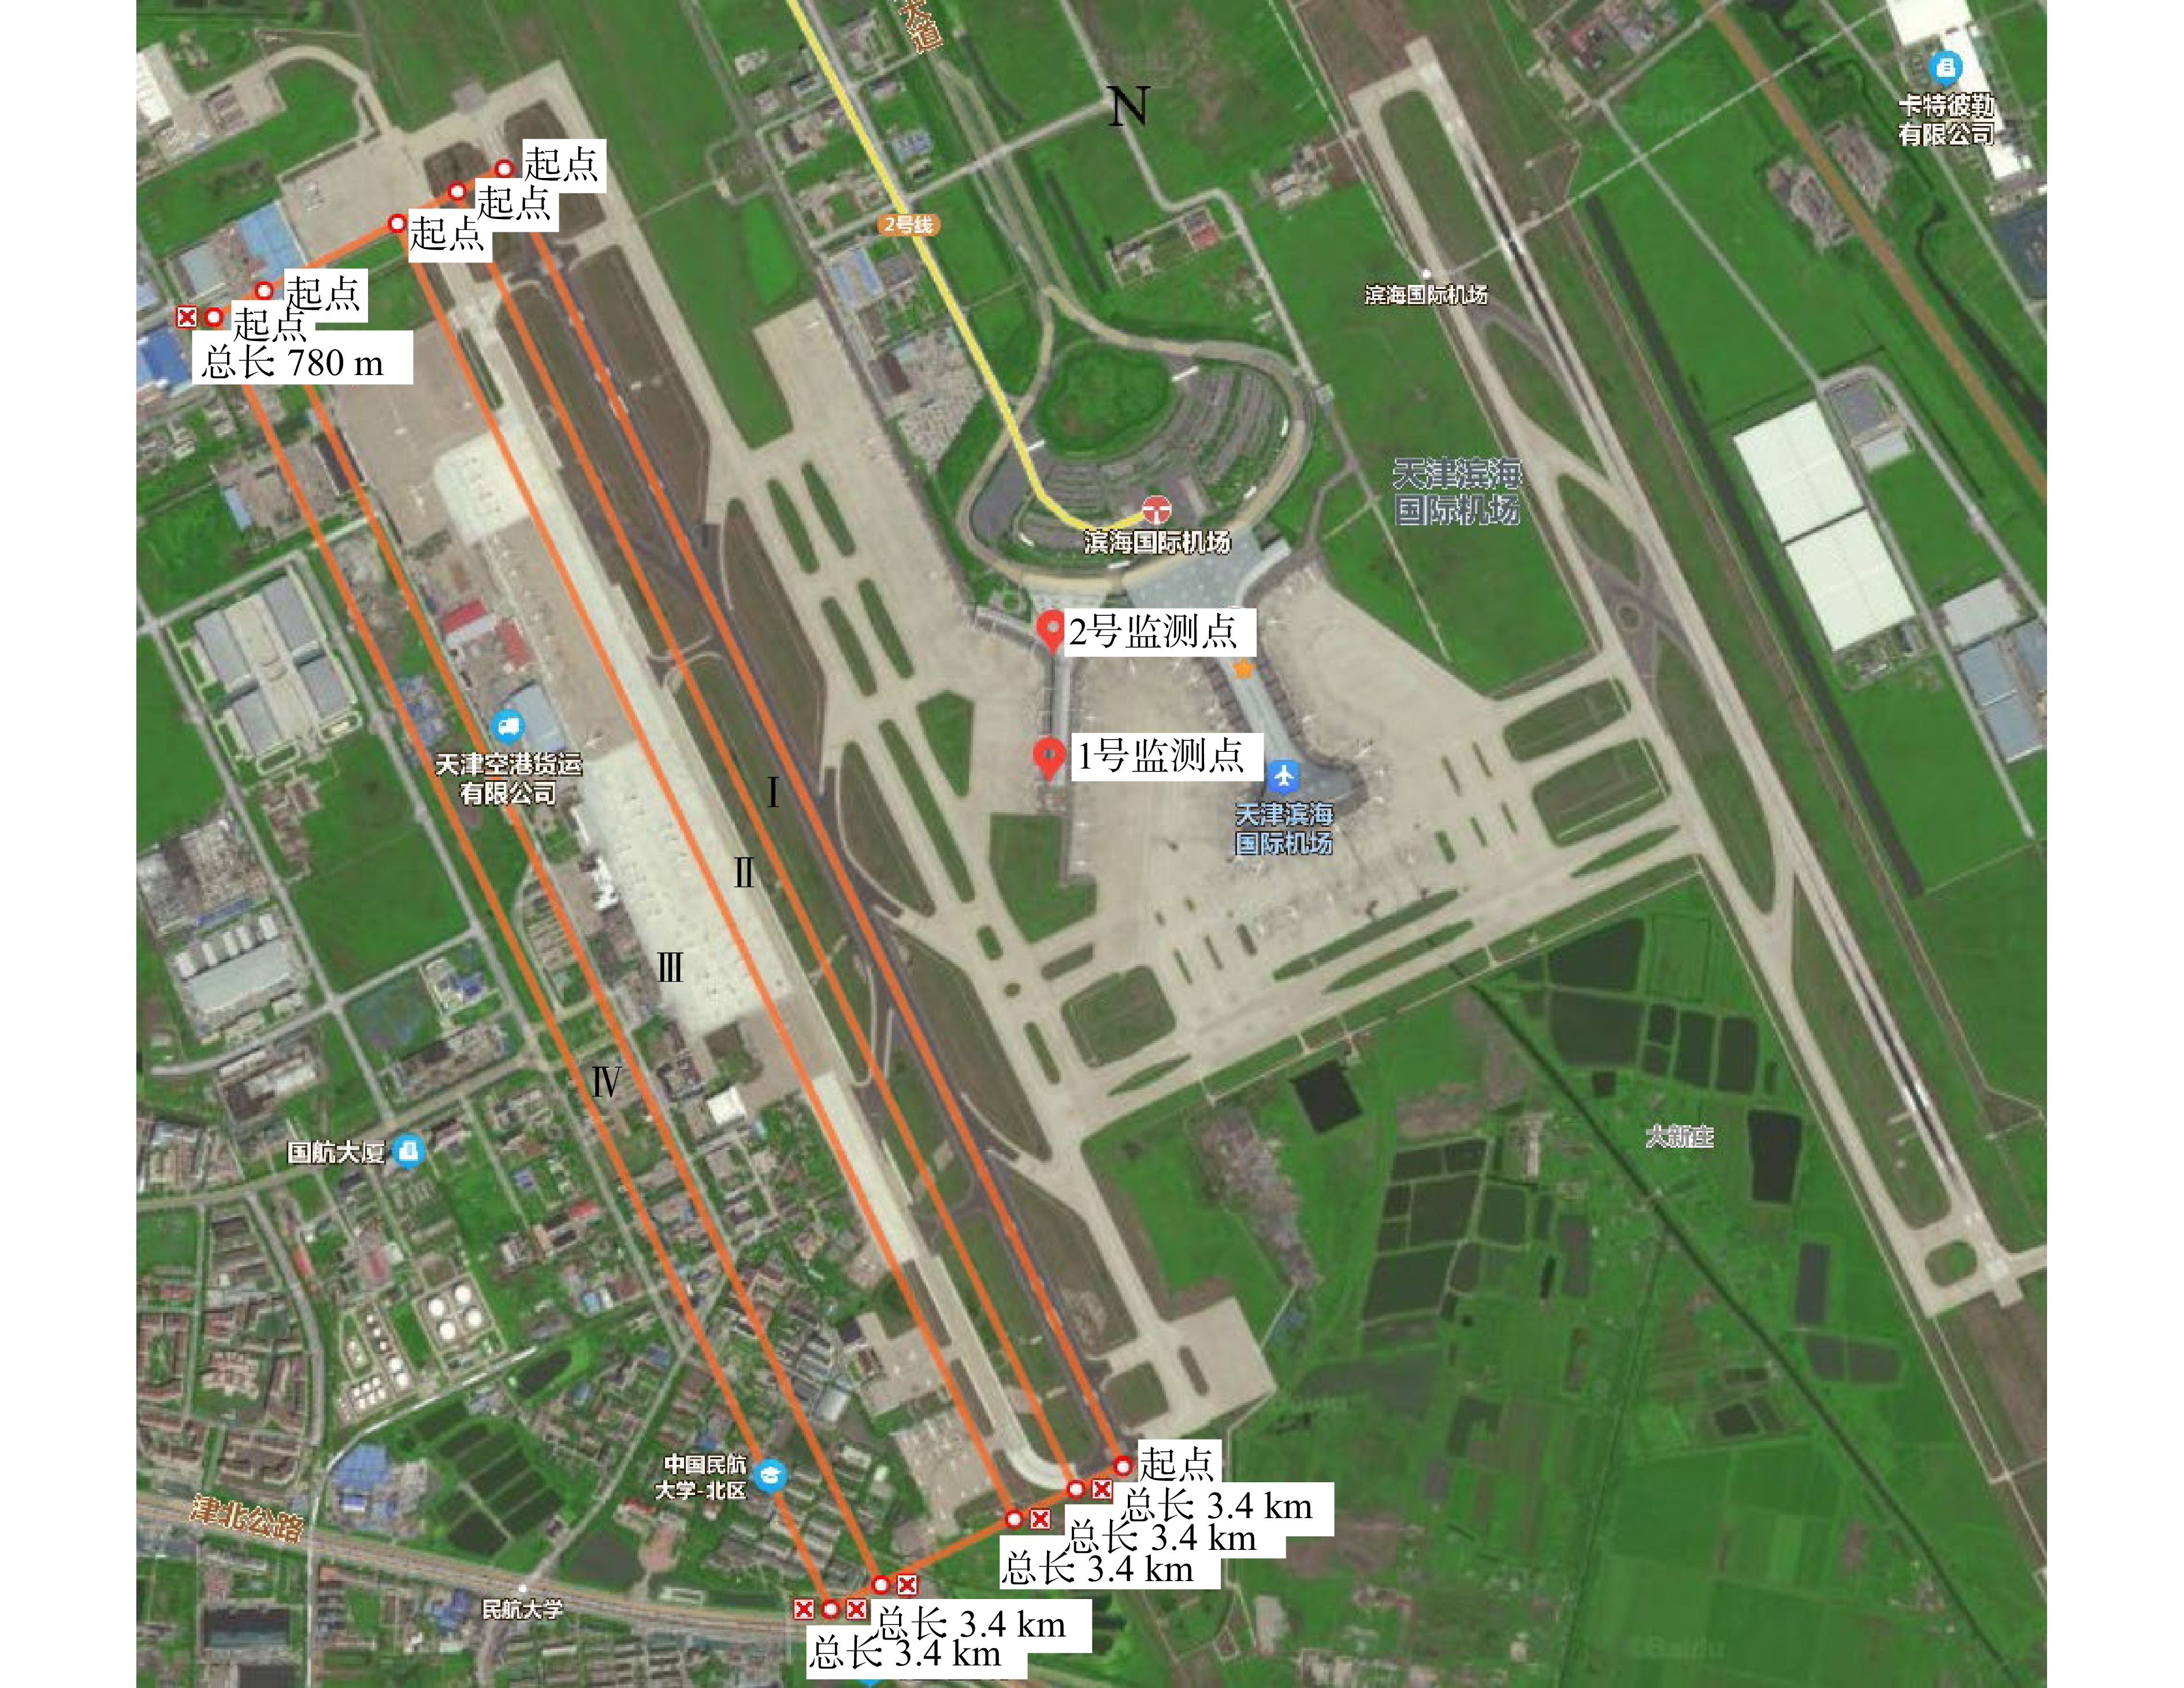
表 5 监测点布设依据
Table 5. Basis for layout of monitoring points
范围 监测点 布设依据 机场跑道下
风向0~127 m区域Ⅰ号 受飞机起飞爬升阶段排放污染物影响最为严重区域,污染物扩散浓度最高可达576 mg/m3,受其他排放影响较小,此处监测点可在跑道下风向提供飞机起飞爬升阶段最佳的污染物扩散监测数据 机场跑道下
风向127~647 m区域Ⅱ号 跑道下风向127~289 m(跑道下风向289 m处为机场边界)范围,无其他主要排放源,空勤人员、地面服务人员、机场相关保障人员长时间高频率在此范围内活动,污染物扩散浓度范围为107~413 mg/m3,可用于监测无阻挡物影响下的排放污染物自由扩散浓度,提供良好的检验数据。此区域内有机场道路,在监测飞机排放扩散情况时注意避开辅助动力设备、地面保障设备和地面交通工具等的影响 区域Ⅲ号 跑道下风向289~647 m范围,仍处于飞机排放扩散主要影响区域,污染物扩散浓度范围为26.05~427.5 mg/m3。此区域内含中国民航大学校园、航空公司机务维修中心、货运中心、汽修厂及航空相关企业单位等,人员活动密集且范围较为集中,航空排放污染对此区域常驻人员健康存在严重威胁,其数据能够确定航空排放污染等级。此区域监测注意选择合理时段、地点,避开社会车辆、锅炉等污染源影响 机场跑道下
风向647~780 m区域Ⅴ号 跑道下风向647~780 m范围,污染物扩散浓度低于环境标准限值,在0.82~25.95 mg/m3范围。此区域靠近西北侧有中国邮政等极少数单位,东南侧建筑物增多,并有学校、航企等相关常驻单位,能够提供建筑物影响下的污染物扩散对比数据。此区域监测同样需要注意时段、地点选择,避开其他污染源影响 机场跑道上
风向航站楼区域1、2号 分别为:上风向距离跑道最近的544 m处廊桥位置、700 m处航站楼位置,若风向发生改变,则处于污染物扩散监测范围之内,扩散浓度在浓度限值标准附近。此区域离到港旅客、接机人员、机组工作人员活动频繁,也可提供无障碍物影响下的污染物自由扩散数据。此处监测会受到机场其他潜在污染源影响,注意监测时段的选择
下载: 导出CSV
-
[1] 张弛,林宇震,徐华胜,等. 民用航空发动机低排放燃烧室技术发展现状及水平[J]. 航空学报,2014,35(2): 332-350.ZHANG Chi,LIN Yuzhen,XU Huasheng,et al. Development status and level of low emissions combustor technologies for civil aero-engine[J]. Acta Aeronautica et Astronautica Sinica,2014,35(2): 332-350. (in Chinese) [2] CHOI W,HU Shishan,HE Meilu,et al. Neighborhood-scale air quality impacts of emissions from motor vehicles and aircraft[J]. Atmospheric Environment,2013,80: 310-321. doi: 10.1016/j.atmosenv.2013.07.043 [3] FAJERSZTAJN L,GUIMARÃES M T,DUIM E,et al. Health effects of pollution on the residential population near a Brazilian Airport: a perspective based on literature review[J]. Journal of Transport & Health,2019,14: 100565. [4] VIANA M,QUEROL X,ALASTUEY A,et al. Characterising exposure to PM aerosols for an epidemiological study[J]. Atmospheric Environment,2008,42(7): 1552-1568. doi: 10.1016/j.atmosenv.2007.10.087 [5] KAN Haidong,LONDON S J,CHEN Guohai,et al. Differentiating the effects of fine and coarse particles on daily mortality in Shanghai, China[J]. Environment International,2007,33(3): 376-384. doi: 10.1016/j.envint.2006.12.001 [6] 中国民用航空局. 2020年民航机场生产统计公报[R]. 北京: 中国民用航空局发展计划司, 2021. [7] 邓海超. 我国支线机场高质量发展问题探析[J]. 民航管理,2021(3): 44-47.DENG Haichao. Analysis on the high-quality development of regional airports in China[J]. Civil Aviation Management,2021(3): 44-47. (in Chinese) [8] International Civil Aviation Organization. Airport air quality manual[R]. Montreal, US: International Civil Aviation Organization, 2011. [9] VAN PHAM V,TANG Jiangjun,ALAM S,et al. Aviation emission inventory development and analysis[J]. Environmental Modelling & Software,2010,25(12): 1738-1753. [10] OWEN B,LEE D S,LIM L. Flying into the future: aviation emissions scenarios to 2050[J]. Environmental Science & Technology,2010,44(7): 2255-2260. [11] 韩博,刘雅婷,谭宏志,等. 一次航班飞行全过程大气污染物排放特征[J]. 环境科学学报,2017,37(12): 4492-4502. doi: 10.13671/j.hjkxxb.2017.0299HAN Bo,LIU Yating,TAN Hongzhi,et al. Emission characterization of civil aviation aircraft during a whole flight[J]. Acta Scientiae Circumstantiae,2017,37(12): 4492-4502. (in Chinese) doi: 10.13671/j.hjkxxb.2017.0299 [12] 曹惠玲,汤鑫豪,苗佳禾. 基于P3-T3方法的飞机LTO阶段氮氧化物排放量计算与分析[J]. 环境科学学报,2019,39(12): 4235-4241.CAO Huiling,TANG Xinhao,MIAO Jiahe. Calculation and analysis of nitrogen oxide emission from airplane LTO stage based on P3-T3 method[J]. Acta Scientiae Circumstantiae,2019,39(12): 4235-4241. (in Chinese) [13] 汤鑫豪. 基于Gaussian puff模型的航空器排放扩散特性研究[D]. 天津: 中国民航大学, 2020: 35-48.TANG Xinhao. Research on aircraft emission and diffusion characteristics based on Gaussian puff model[D]. Tianjin: Civil Aviation University of China, 2020: 35-48. (in Chinese) [14] 曹惠玲,晏嘉伟,李玉铭. 结合QAR数据的全航段排放估算及其对飞行成本的影响研究[J]. 环境科学学报,2021,41(11): 4439-4448. doi: 10.13671/j.hjkxxb.2021.0261CAO Huiling,YAN Jiawei,LI Yuming. Research on emission estimation of full flight segments combined with QAR Data and its impact on flight cost[J]. Acta Scientiae Circumstantiae,2021,41(11): 4439-4448. (in Chinese) doi: 10.13671/j.hjkxxb.2021.0261 [15] DAS S K,DURBIN P A. Prediction of atmospheric dispersion of pollutants in an airport environment[J]. Atmospheric Environment,2007,41(6): 1328-1341. doi: 10.1016/j.atmosenv.2006.09.050 [16] BARRETT S R H,BRITTER R E,WAITZ I A. Impact of aircraft plume dynamics on airport local air quality[J]. Atmospheric Environment,2013,74: 247-258. doi: 10.1016/j.atmosenv.2013.03.061 [17] HSU H H,ADAMKIEWICZ G,ANDRES HOUSEMAN E,et al. The relationship between aviation activities and ultrafine particulate matter concentrations near a mid-sized airport[J]. Atmospheric Environment,2012,50: 328-337. doi: 10.1016/j.atmosenv.2011.12.002 [18] 韩博,孔魏凯,谭宏志,等. 飞机LTO排放影响评估耦合模型研究与应用[J]. 中国环境科学,2020,40(6): 2409-2417. doi: 10.3969/j.issn.1000-6923.2020.06.010HAN Bo,KONG Weikai,TAN Hongzhi,et al. A coupling model and its application on impact assessment of the aircraft emissions during LTO cycle[J]. China Environmental Science,2020,40(6): 2409-2417. (in Chinese) doi: 10.3969/j.issn.1000-6923.2020.06.010 [19] 李玉铭. 飞机全航段PM排放特性与扩散模型优化研究[D]. 天津: 中国民航大学, 2021: 23-24.LI Yuming. Study on PM emission characteristics and diffusion model optimization of aircraft in the whole flight segment[D]. Tianjin: Civil Aviation University of China, 2021: 23-24. (in Chinese) [20] 曹惠玲,李玉铭,晏嘉伟,等. 基于修正Gaussian Puff模型的飞机LTO循环PM2.5排放及扩散特性研究[J]. 环境科学学报,2022,42(3): 352-361.CAO Huiling,LI Yuming,YAN Jiawei,et al. Research on PM2.5 emission and diffusion characteristics of aircraft LTO cycle based on modified Gaussian Puff model[J]. Acta Scientiae Circumstantiae,2022,42(3): 352-361. (in Chinese) [21] SEIGNEUR C,PAI P,TOMBACH I,et al. Modeling of potential power plant plume impacts on Dallas-Fort Worth visibility[J]. Journal of the Air & Waste Management Association,2000,50(5): 835-848. [22] PORTÉ-AGEL F,PAHLOW M,MENEVEAU C,et al. Atmospheric stability effect on subgrid-scale physics for large-eddy simulation[J]. Advances in Water Resources,2001,24(9/10): 1085-1102. [23] International Civil Aviation Organization. Engine exhaust emissions data bank[R]. International Civil Aviation Organization Doc 9646-AN/943, 2013. [24] 环境保护部, 国家质量监督检验检疫总局. 环境空气质量标准: GB 3095-2012[S]. 北京: 中国环境科学出版社, 2012. [25] WAYSON R L,FLEMING G G,IOVINELLI R. Methodology to estimate particulate matter emissions from certified commercial aircraft engines[J]. Journal of the Air & Waste Management Association,2009,59(1): 91-100. [26] 邹味莲,于苏俊. 环境影响评价中大气环境防护距离和卫生防护距离的探讨[J]. 青海环境,2013,23(1): 23-25, 43. doi: 10.3969/j.issn.1007-2454.2013.01.006ZOU Weilian,YU Sujun. Discussion on atmospheric environmental protection distance and health protection distance in environmental impact assessment[J]. Journal of Qinghai Environment,2013,23(1): 23-25, 43. (in Chinese) doi: 10.3969/j.issn.1007-2454.2013.01.006 -


 点击查看大图

计量
- 文章访问数: 864
- HTML浏览量: 603
- PDF量: 65
- 被引次数: 0