






Scaling effect on transonic rotor aerodynamic performances and loss mechanisms
-
摘要:
J级重型燃气轮机(进口设计流量约1 000 kg/s)的首级压气机直径可达3 m,难以开展全尺寸几何模型试验,基于相似原理开展缩尺研究是一种经济且简便可行的方法。基于数值方法开展尺寸效应对小/大模型性能及损失影响的对比研究,分析尺寸效应对小/大模型损失影响机制。性能分析结果表明:气动相似的大模型等熵效率明显高于缩比模型,而Casey等提出的等熵效率修正模型偏差不超过0.5%。机理分析表明:在叶尖强激波诱导的泄漏涡破碎区域,二次流主导,大模型损失强于小模型;而其他区域则以基元损失为主,边界层和尾迹掺混损失小模型损失更强;但综合损失仍然是小模型更大。因此影响小/大模型等熵效率的差异主要来源于基元边界层和尾迹掺混损失,而叶尖二次流损失造成的差异并不起决定性作用。这项工作致力于给工业重型燃气轮机设计初期提供参考。
-
关键词:
- 尺寸效应 /
- 重型燃气轮机跨声速转子 /
- 气动特性 /
- 等熵效率预测模型 /
- 损失机理
Abstract:It is difficult to conduct the full-scale testing for J-class heavy-duty gas turbine transonic compressors (with an inlet design mass-flow rate of roughly
1000 kg/s), the diameter of the first stage compressor was nearly 3 m, the turbomachinery designers scaled-down the geometry to meet thepower limitation, which is a convenient method based on similarity principle. This work performed comparative investigations of scaling effects on the aerodynamic performance and loss mechanisms based on the numerical simulation. The results showed that the larger model operated at a higher isentropic efficiency condition. The Casey’s prediction models had a deviation of less than 0.5%. The shock/tip leakage vortex loss and shock-boundary layer interaction loss of the larger model were stronger than those in the prototype model, while the profile boundary loss and wake mixing loss of the prototype model were stronger than the larger model. The profile losses (boundary layer and wake mixing loss) were the main loss source causing the difference in the isentropic efficiency between the prototype and scaled-up compressor rotor, meanwhile, the difference caused by tip secondary flow loss was not the main source. This investigation is intended to provide suggestions for industrial preliminary design stages of the heavy-duty gas turbine compressors. -
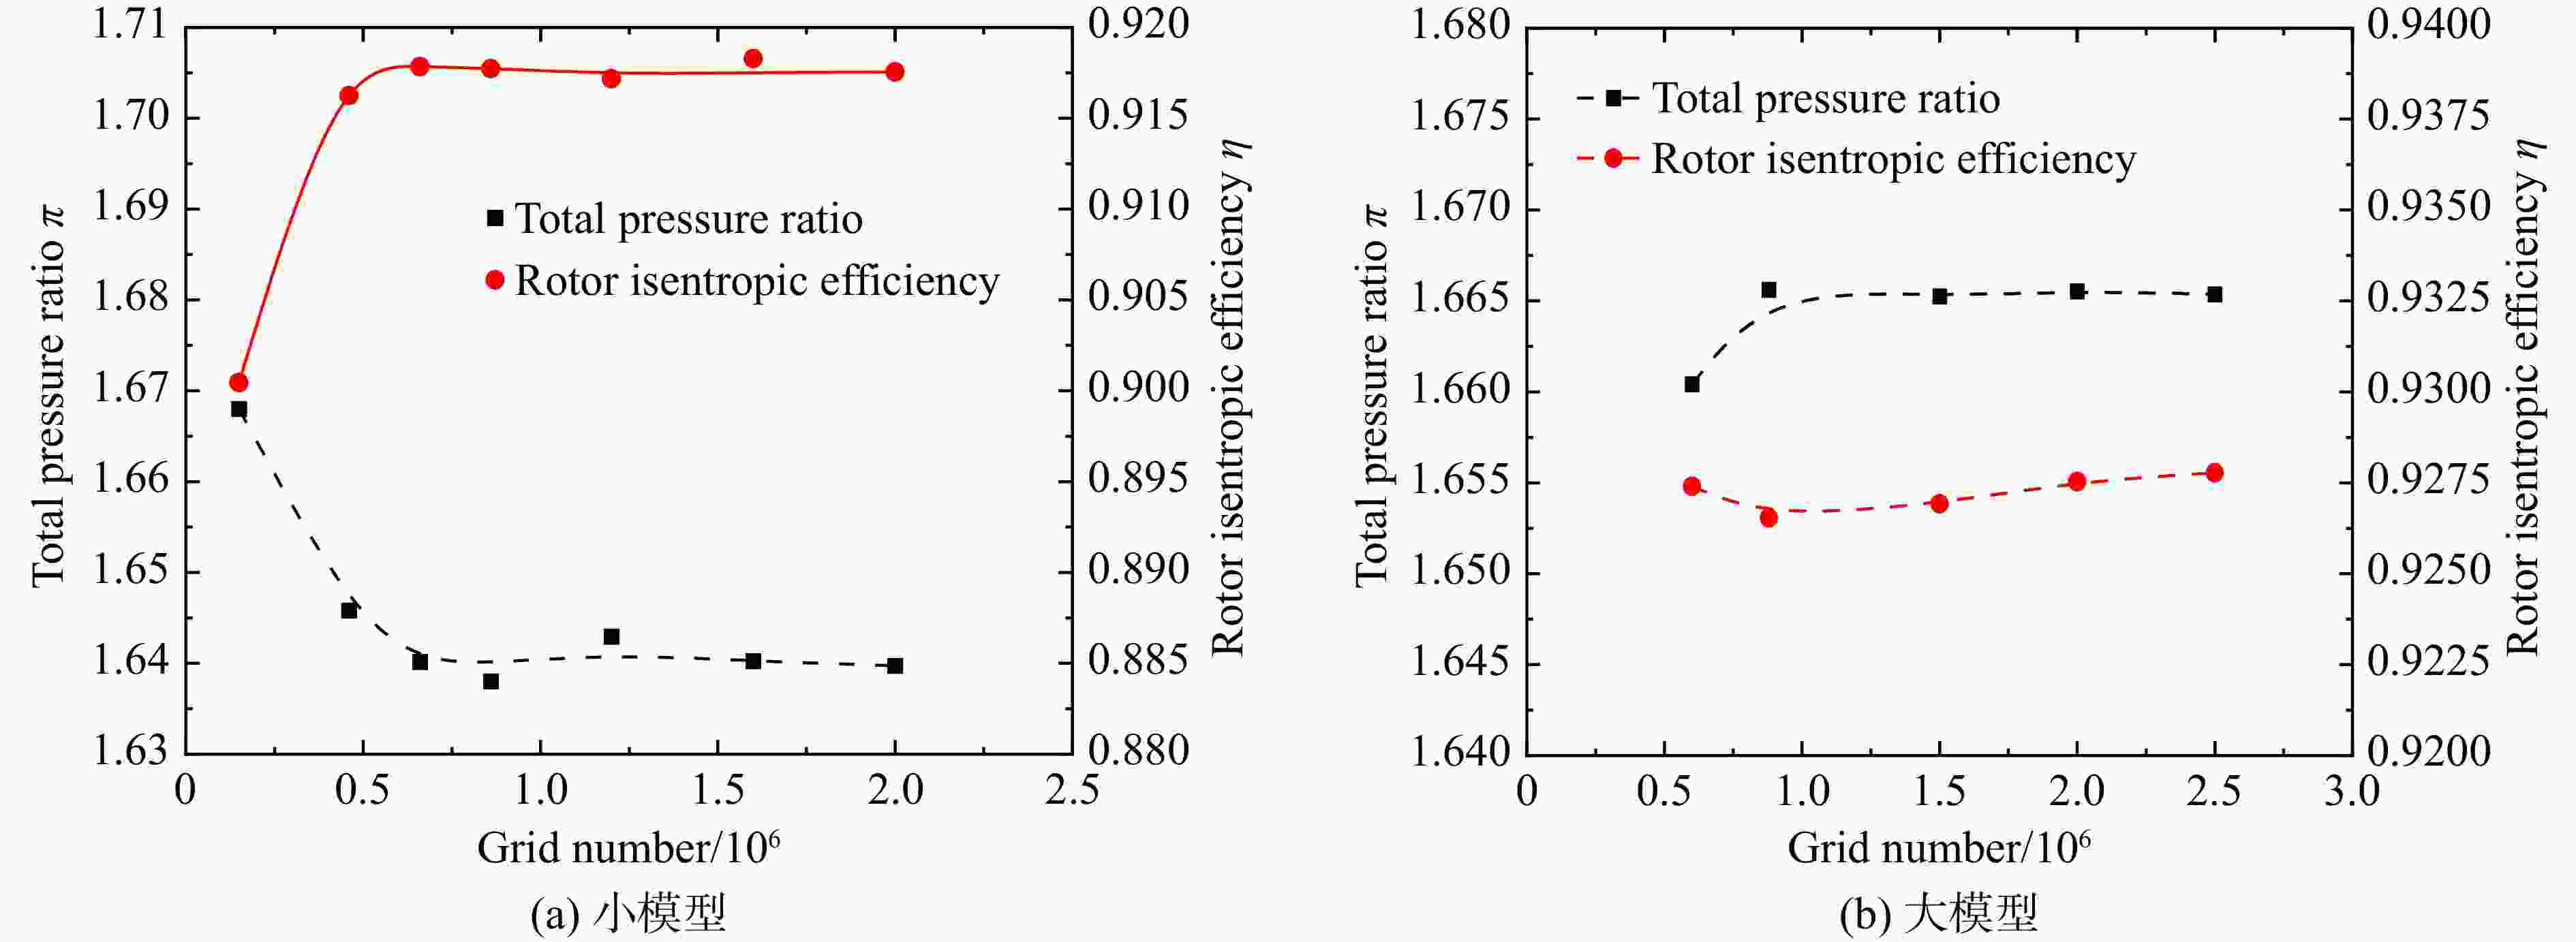
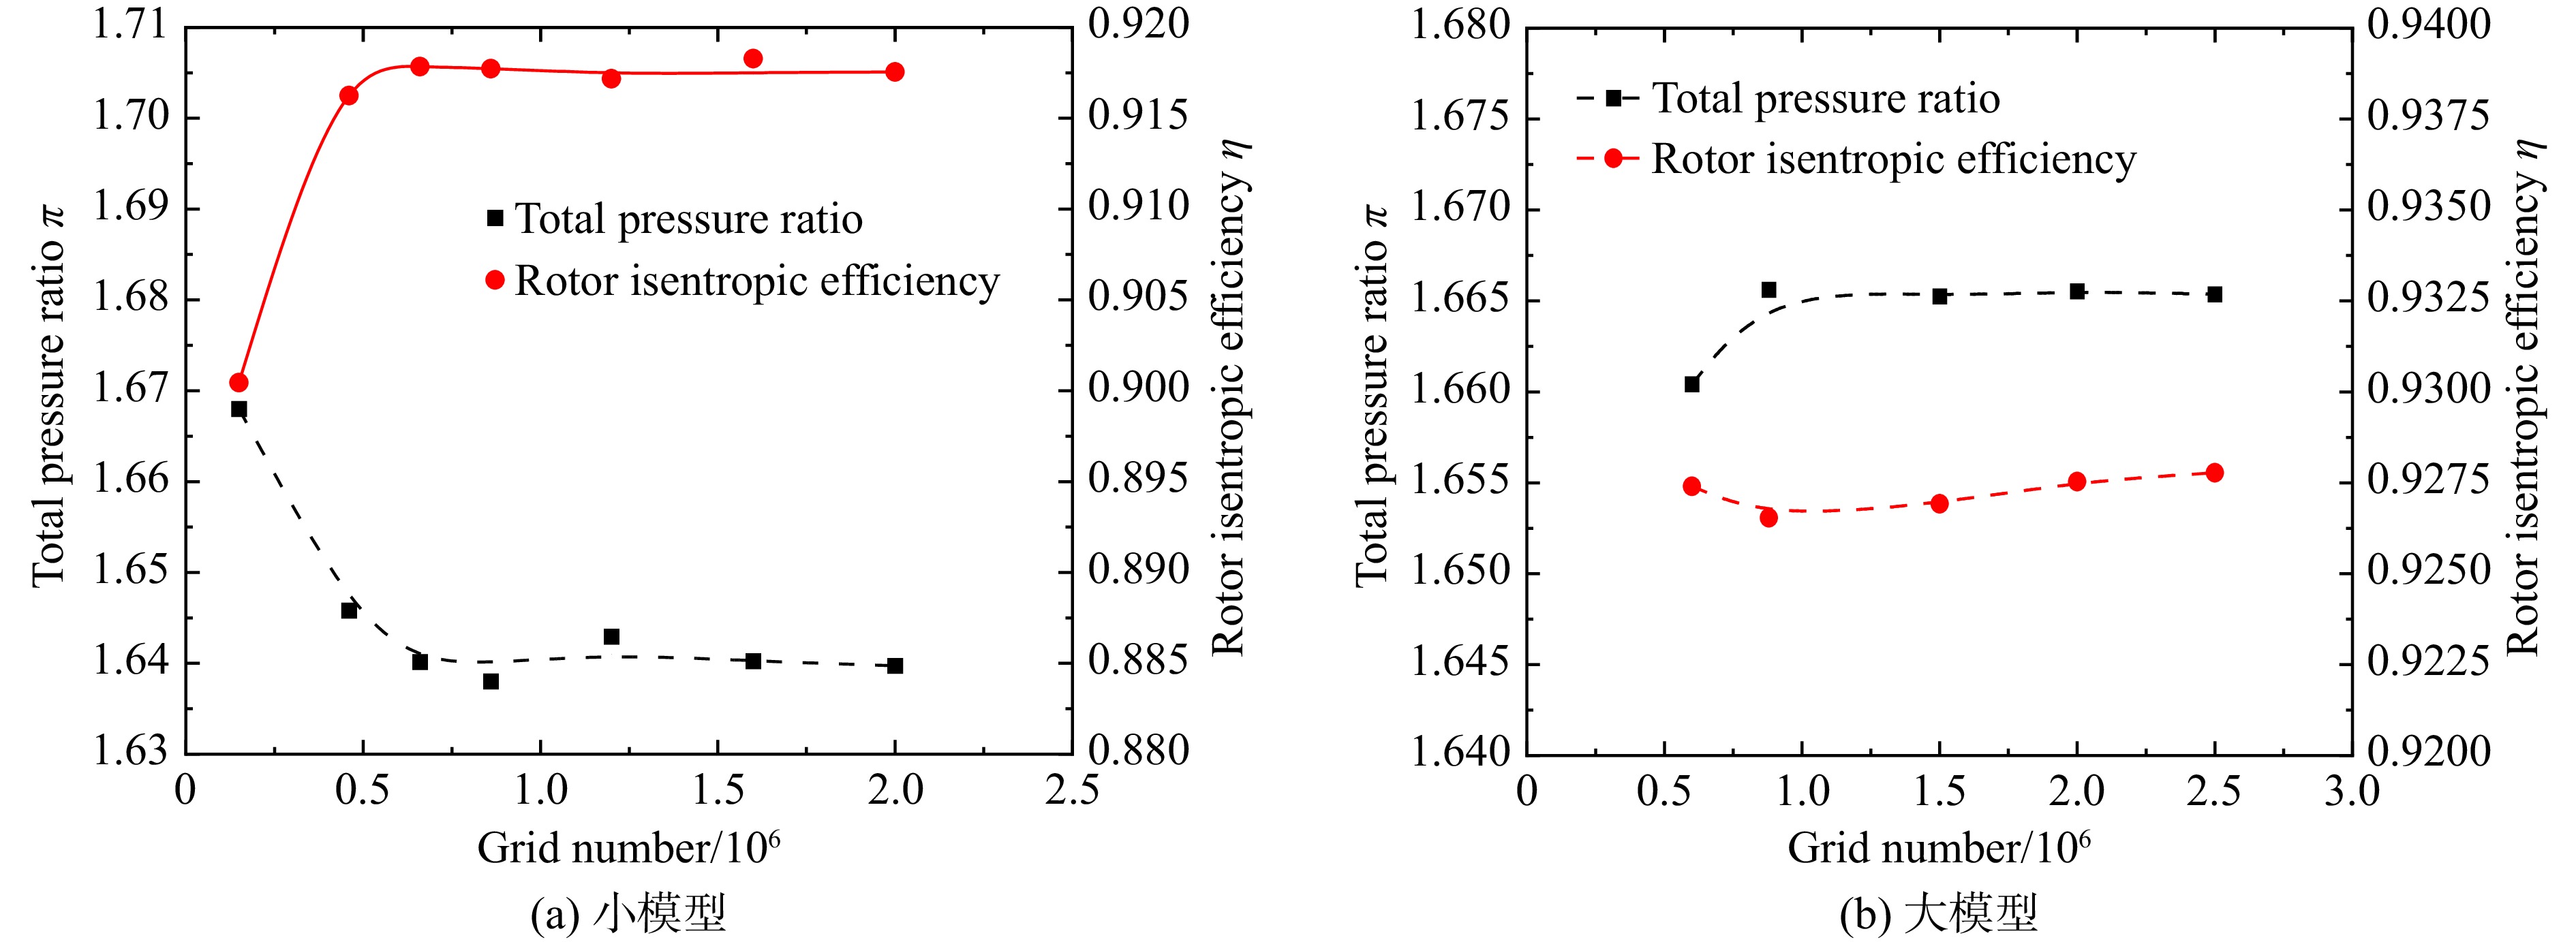
图 3 大/小模型网格无关性验证
Figure 3. Numerical results independence verify with different grid points of prototype and scaled-up model
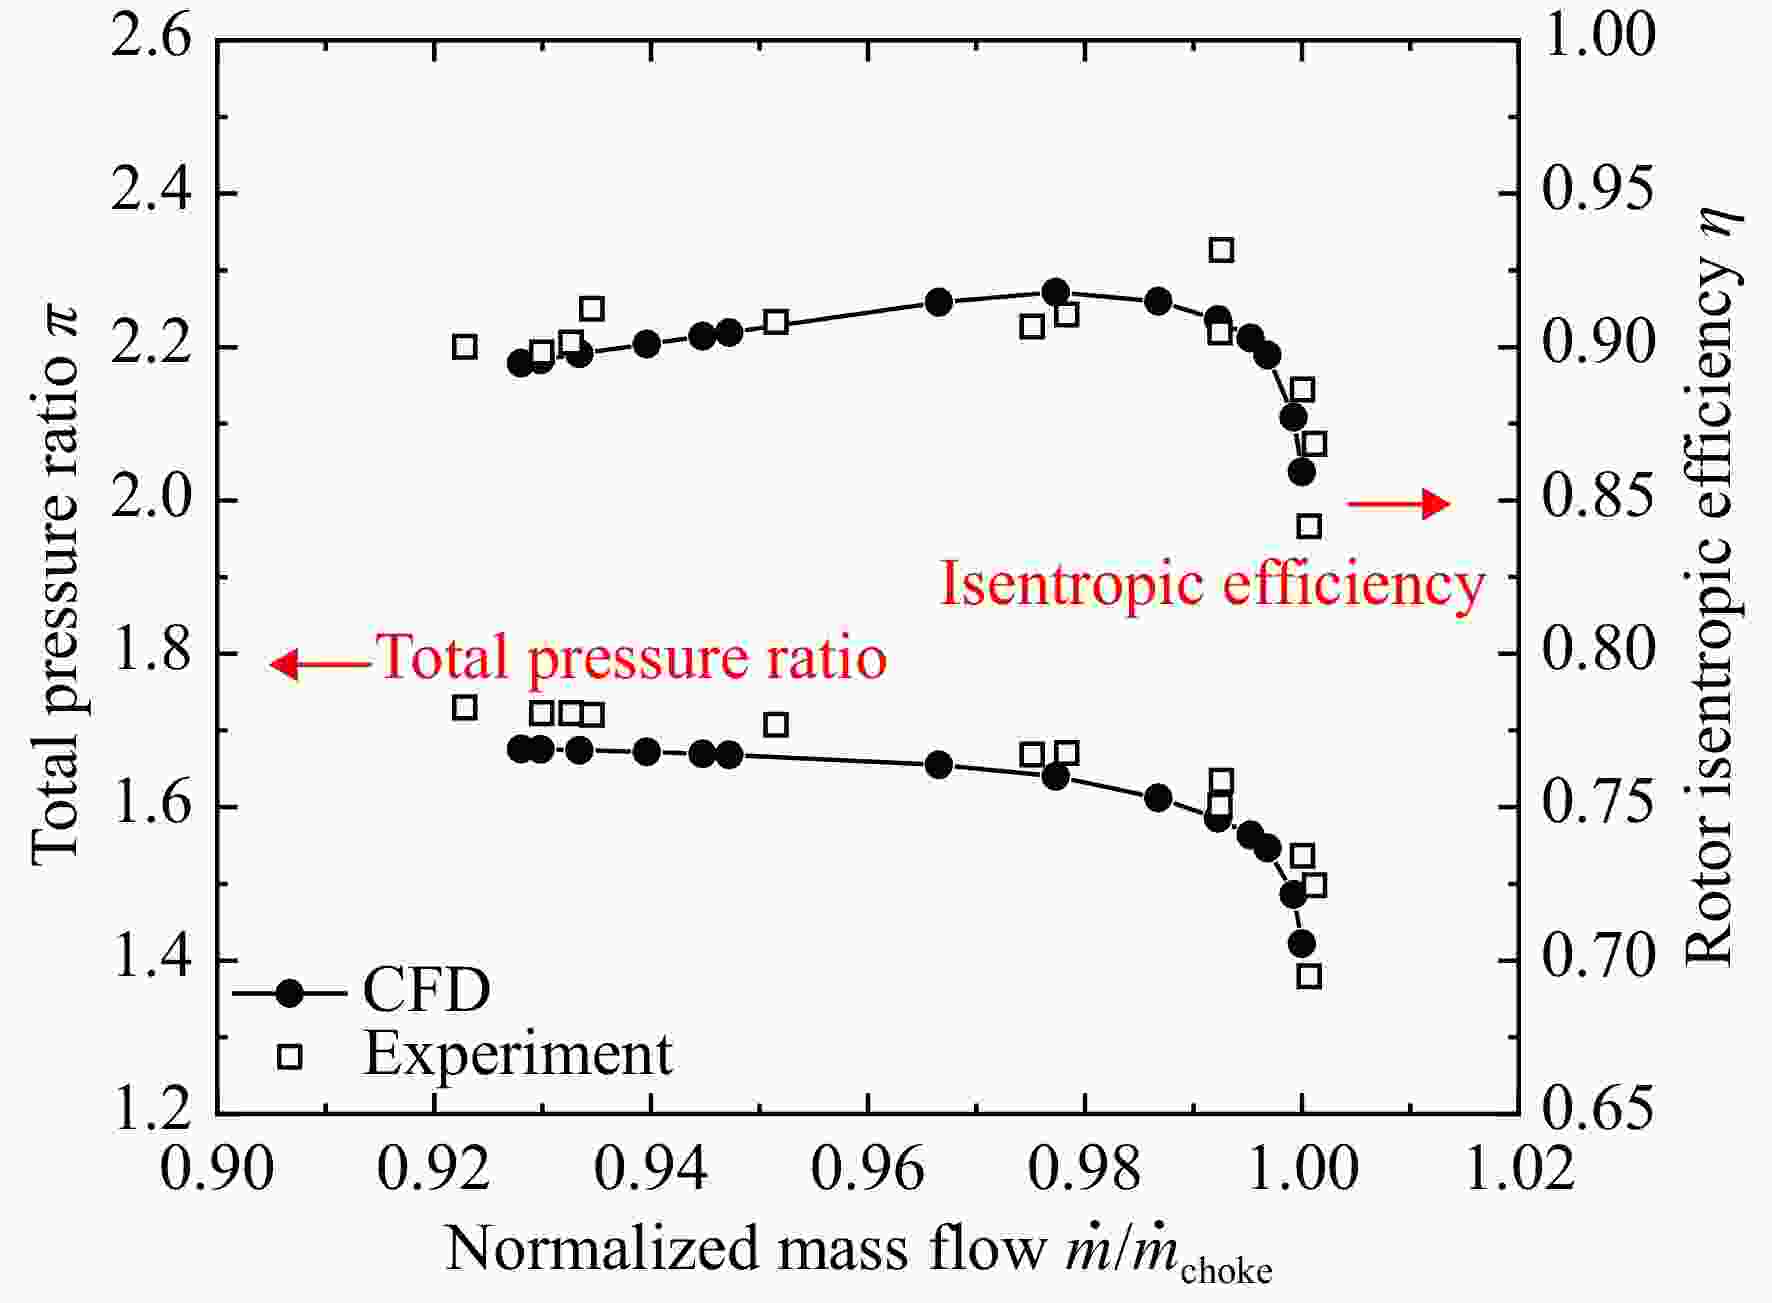
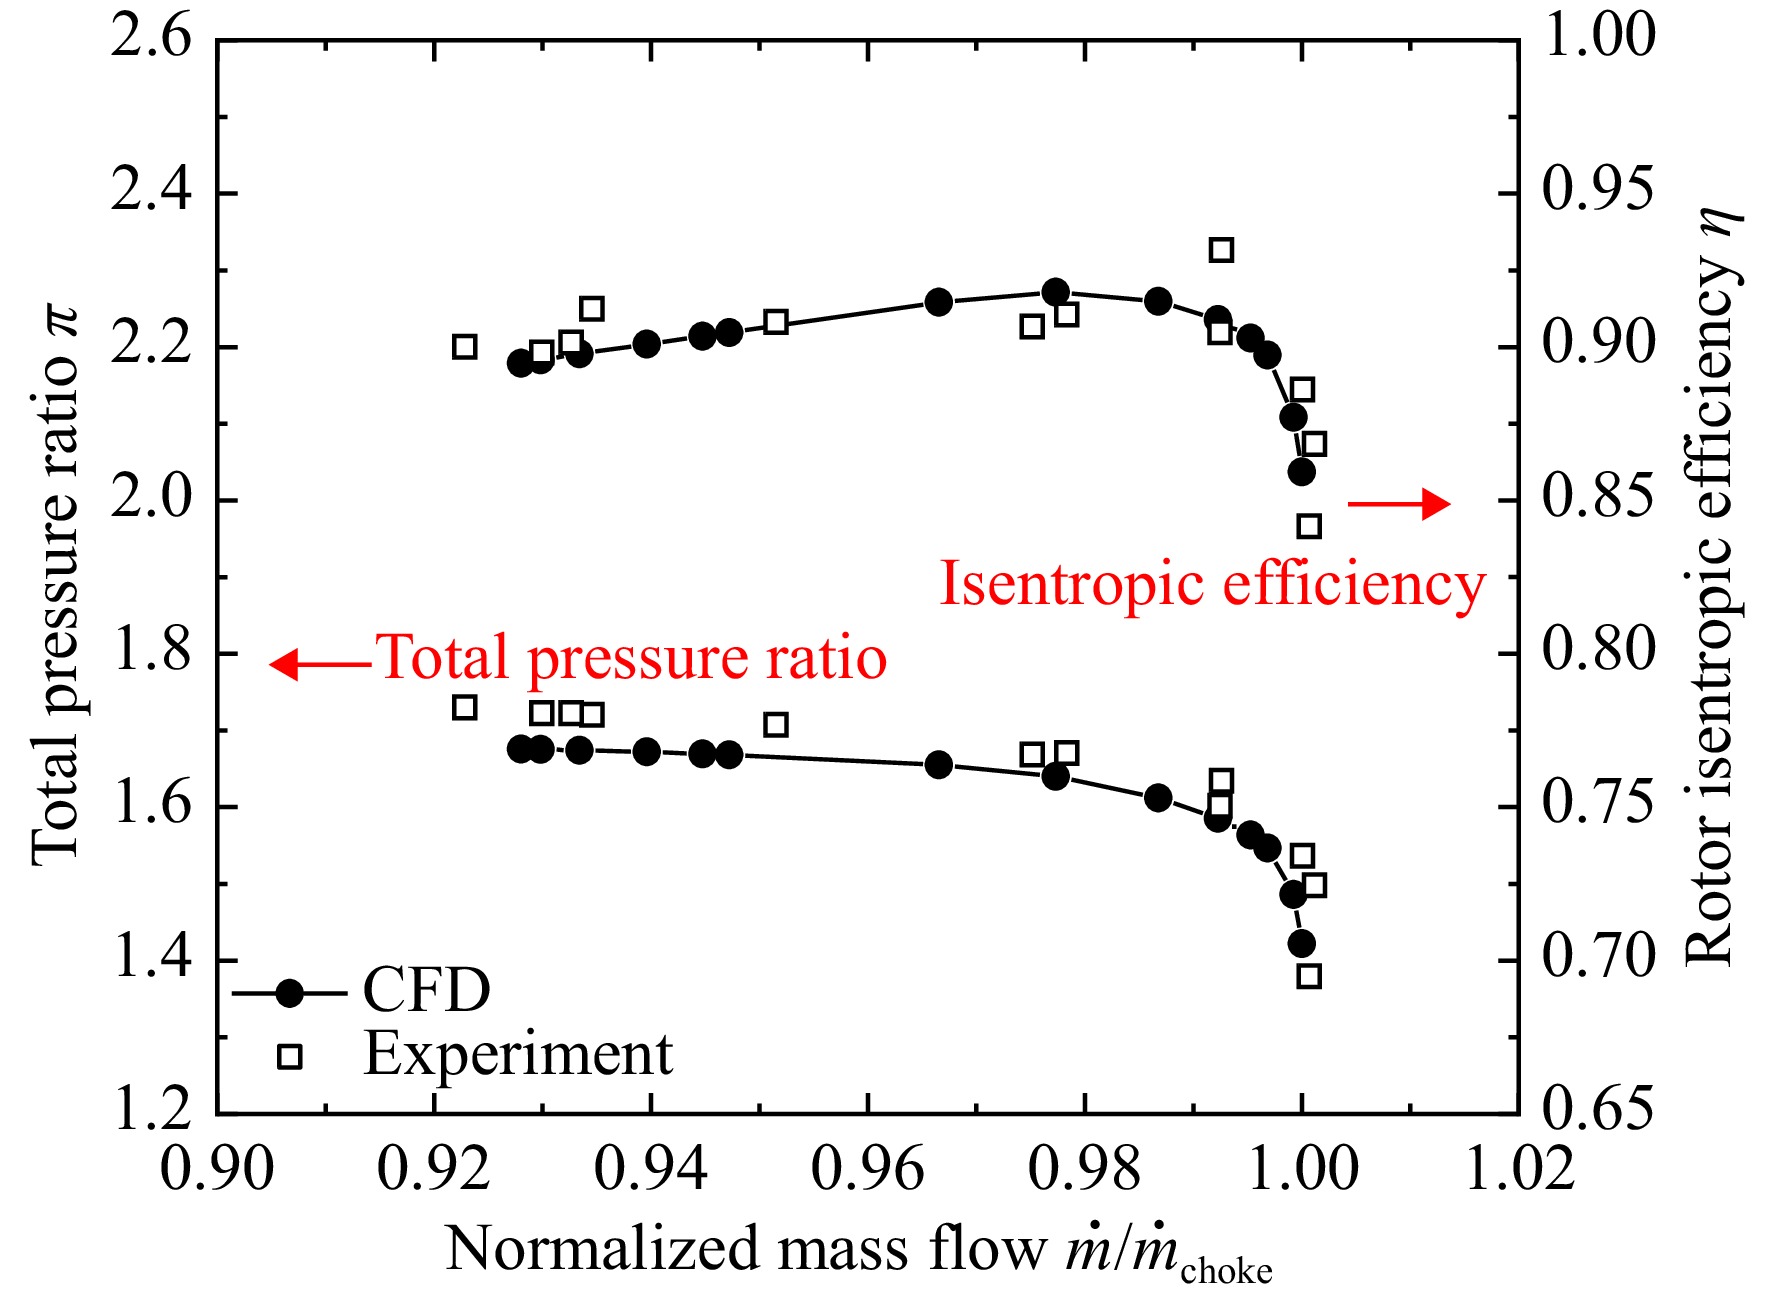
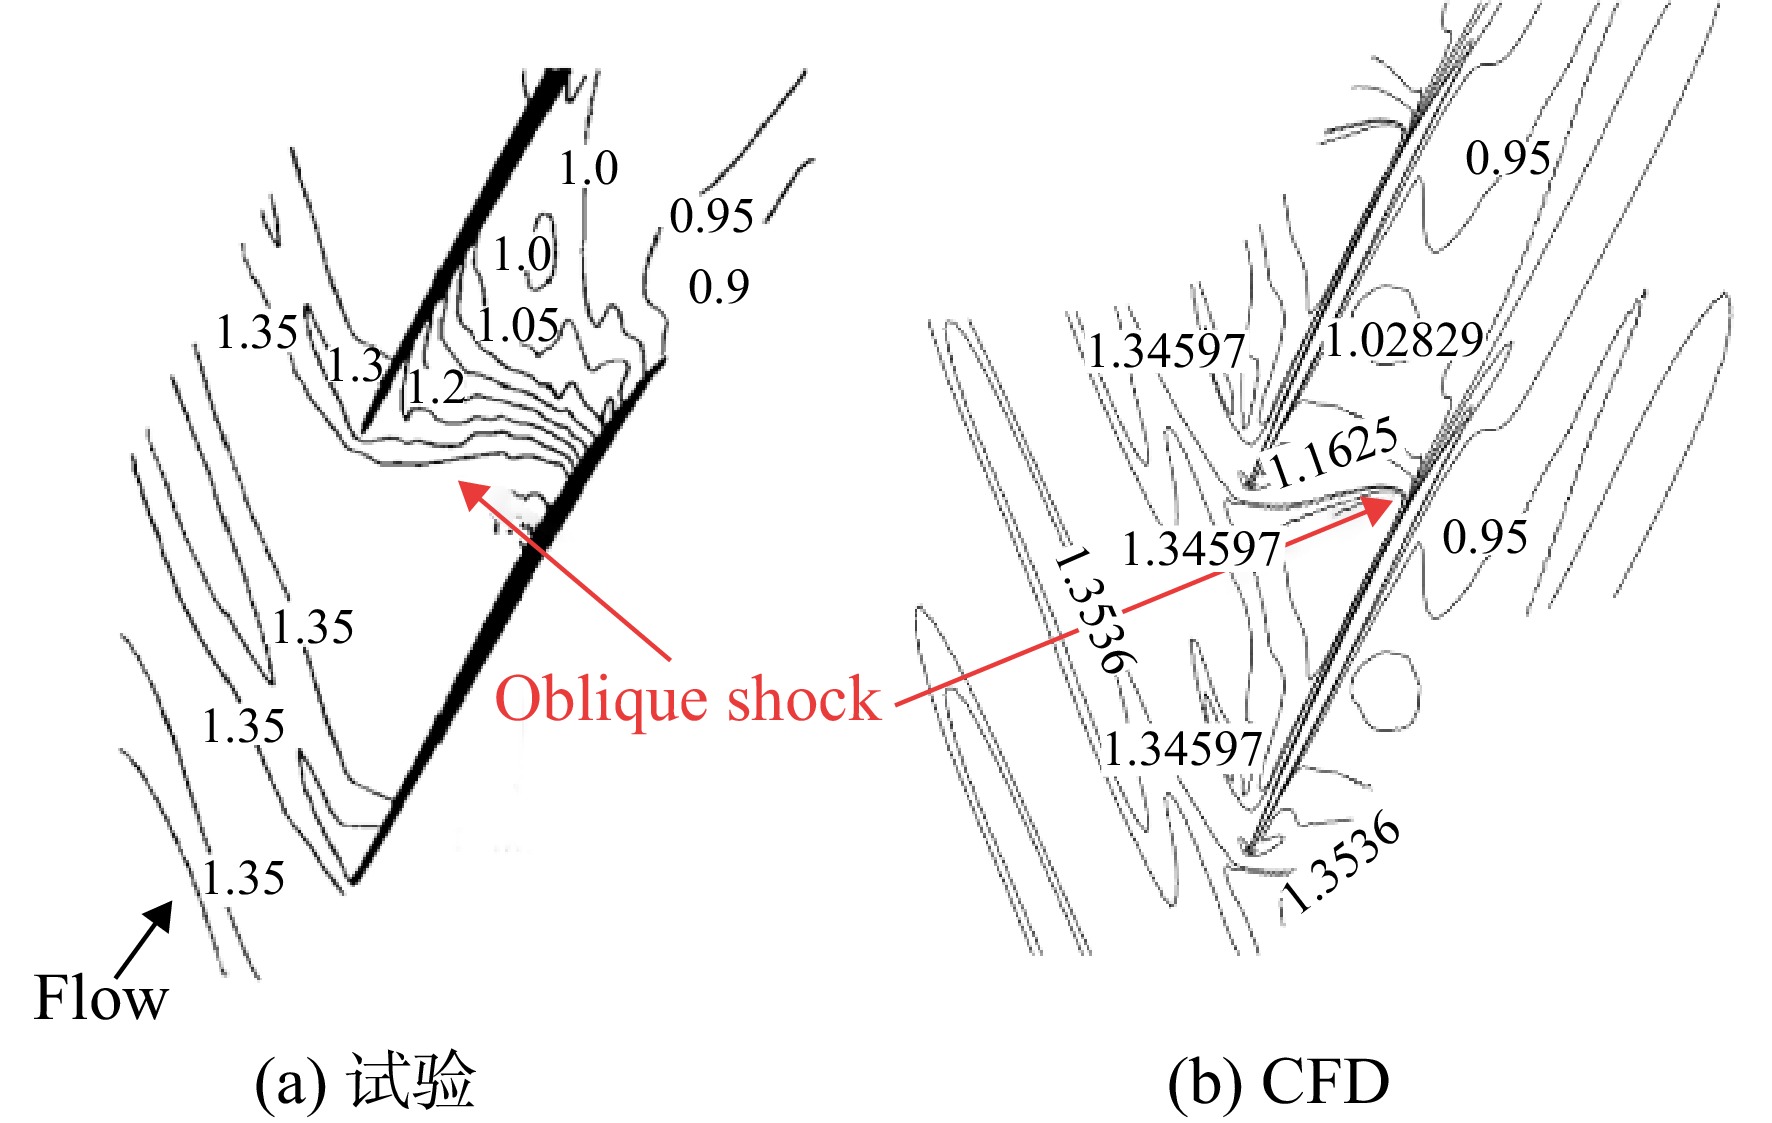
图 4 小模型数值试验特性对比与校核
Figure 4. Comparisons of the numerical and experimental performance of the prototype model
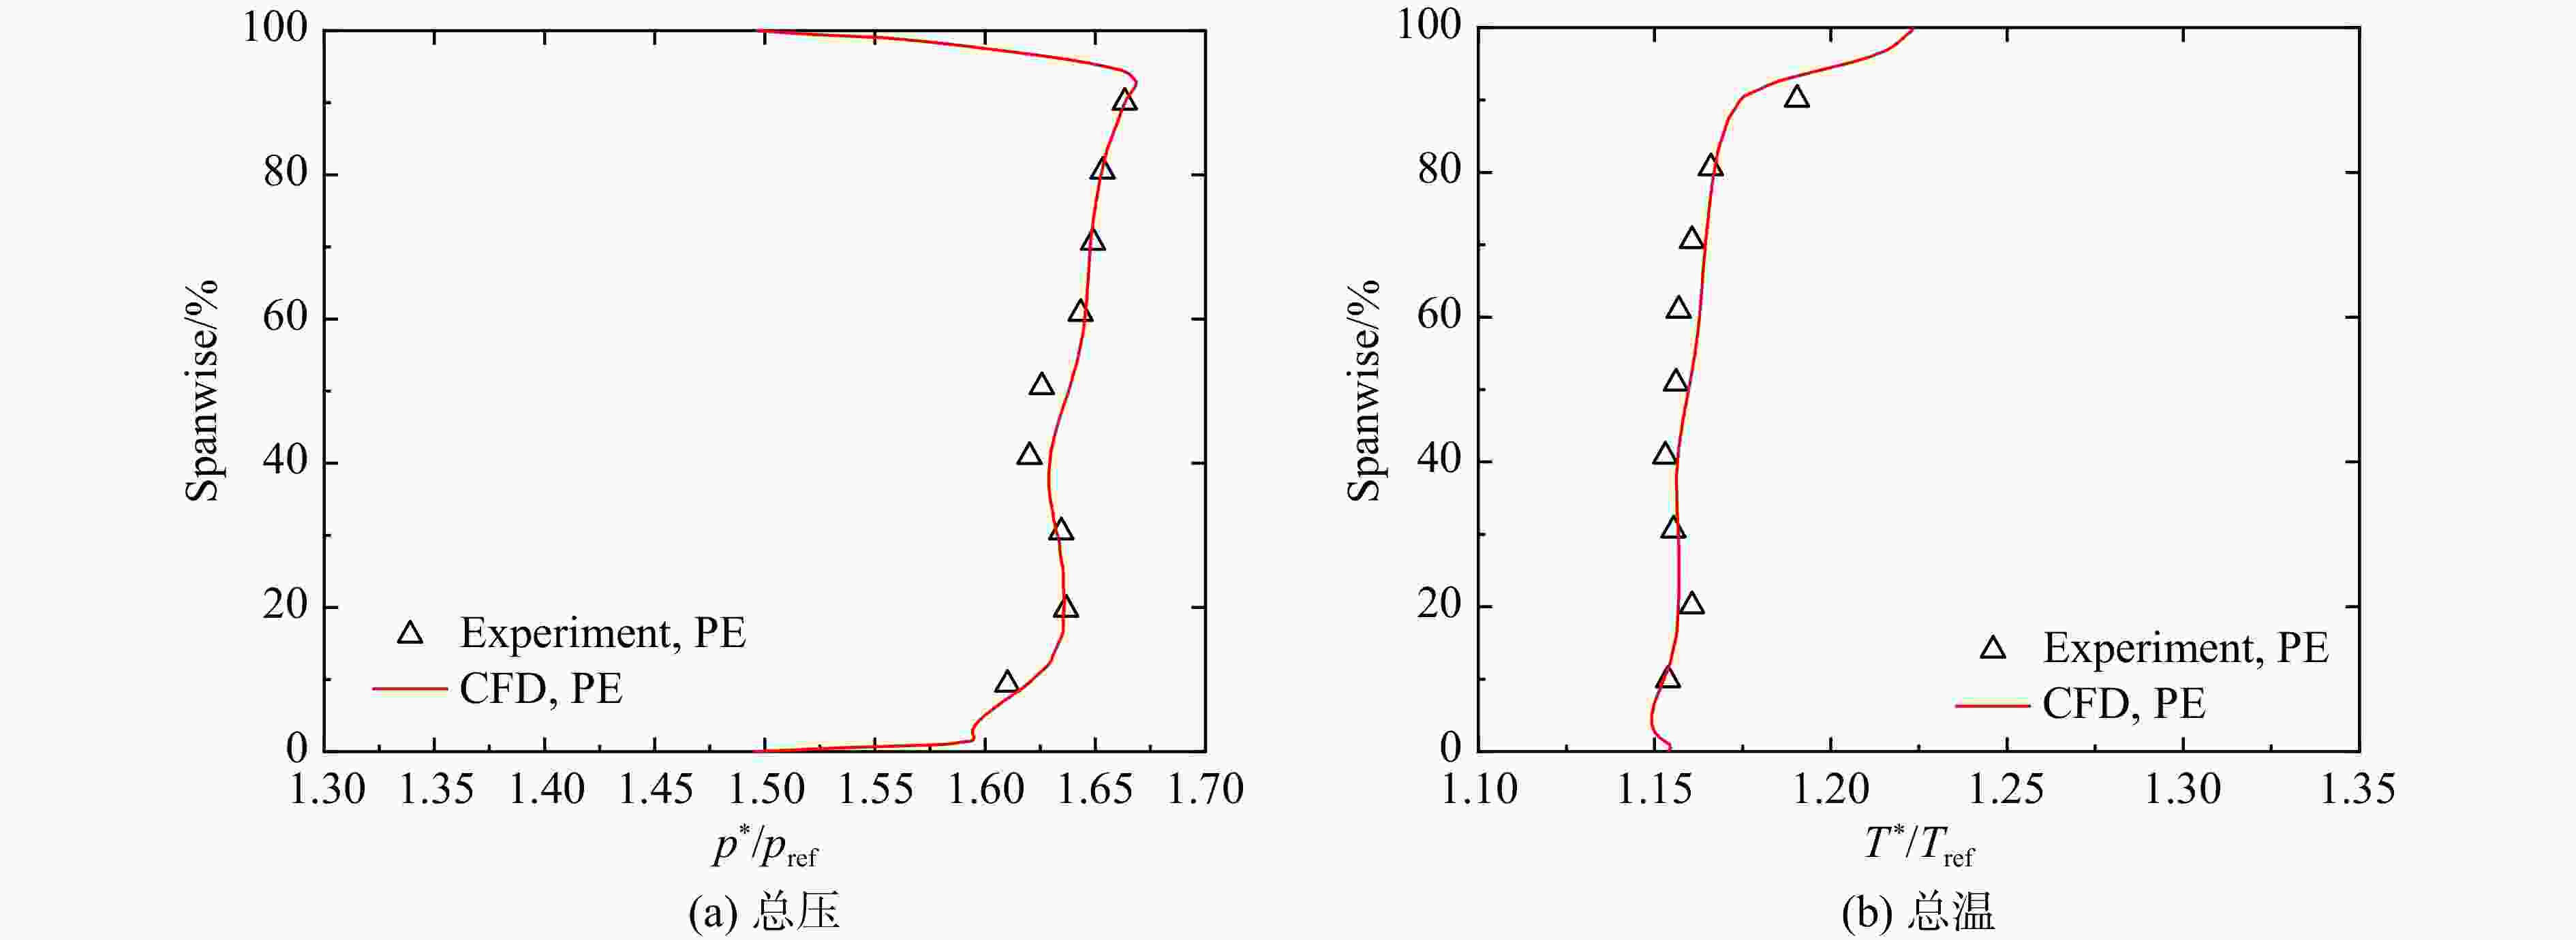
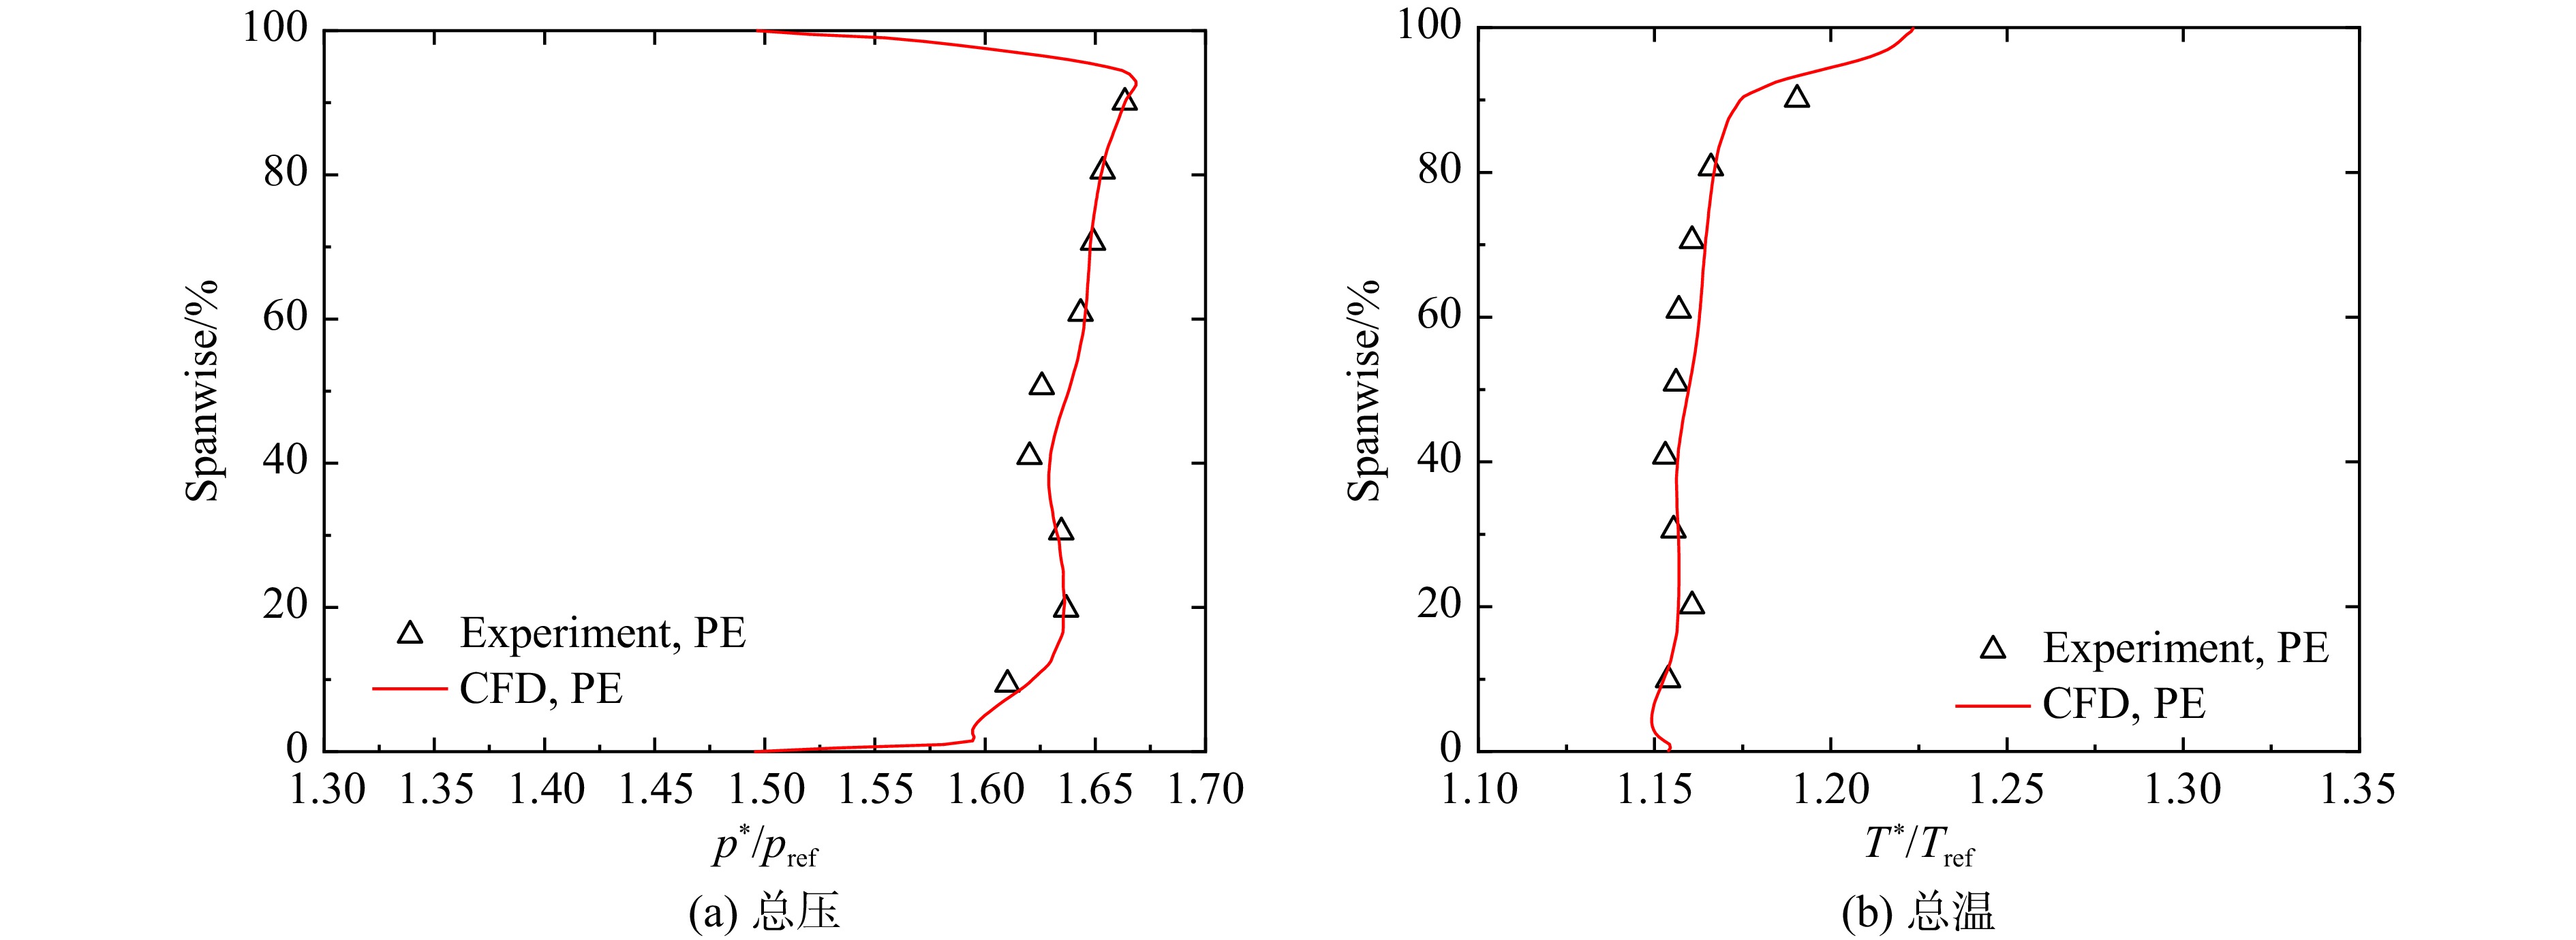
图 5 转子出口总压总温径向分布
Figure 5. Total pressure and total temperature spanwise distribution of the prototype model downstream flow field parameters
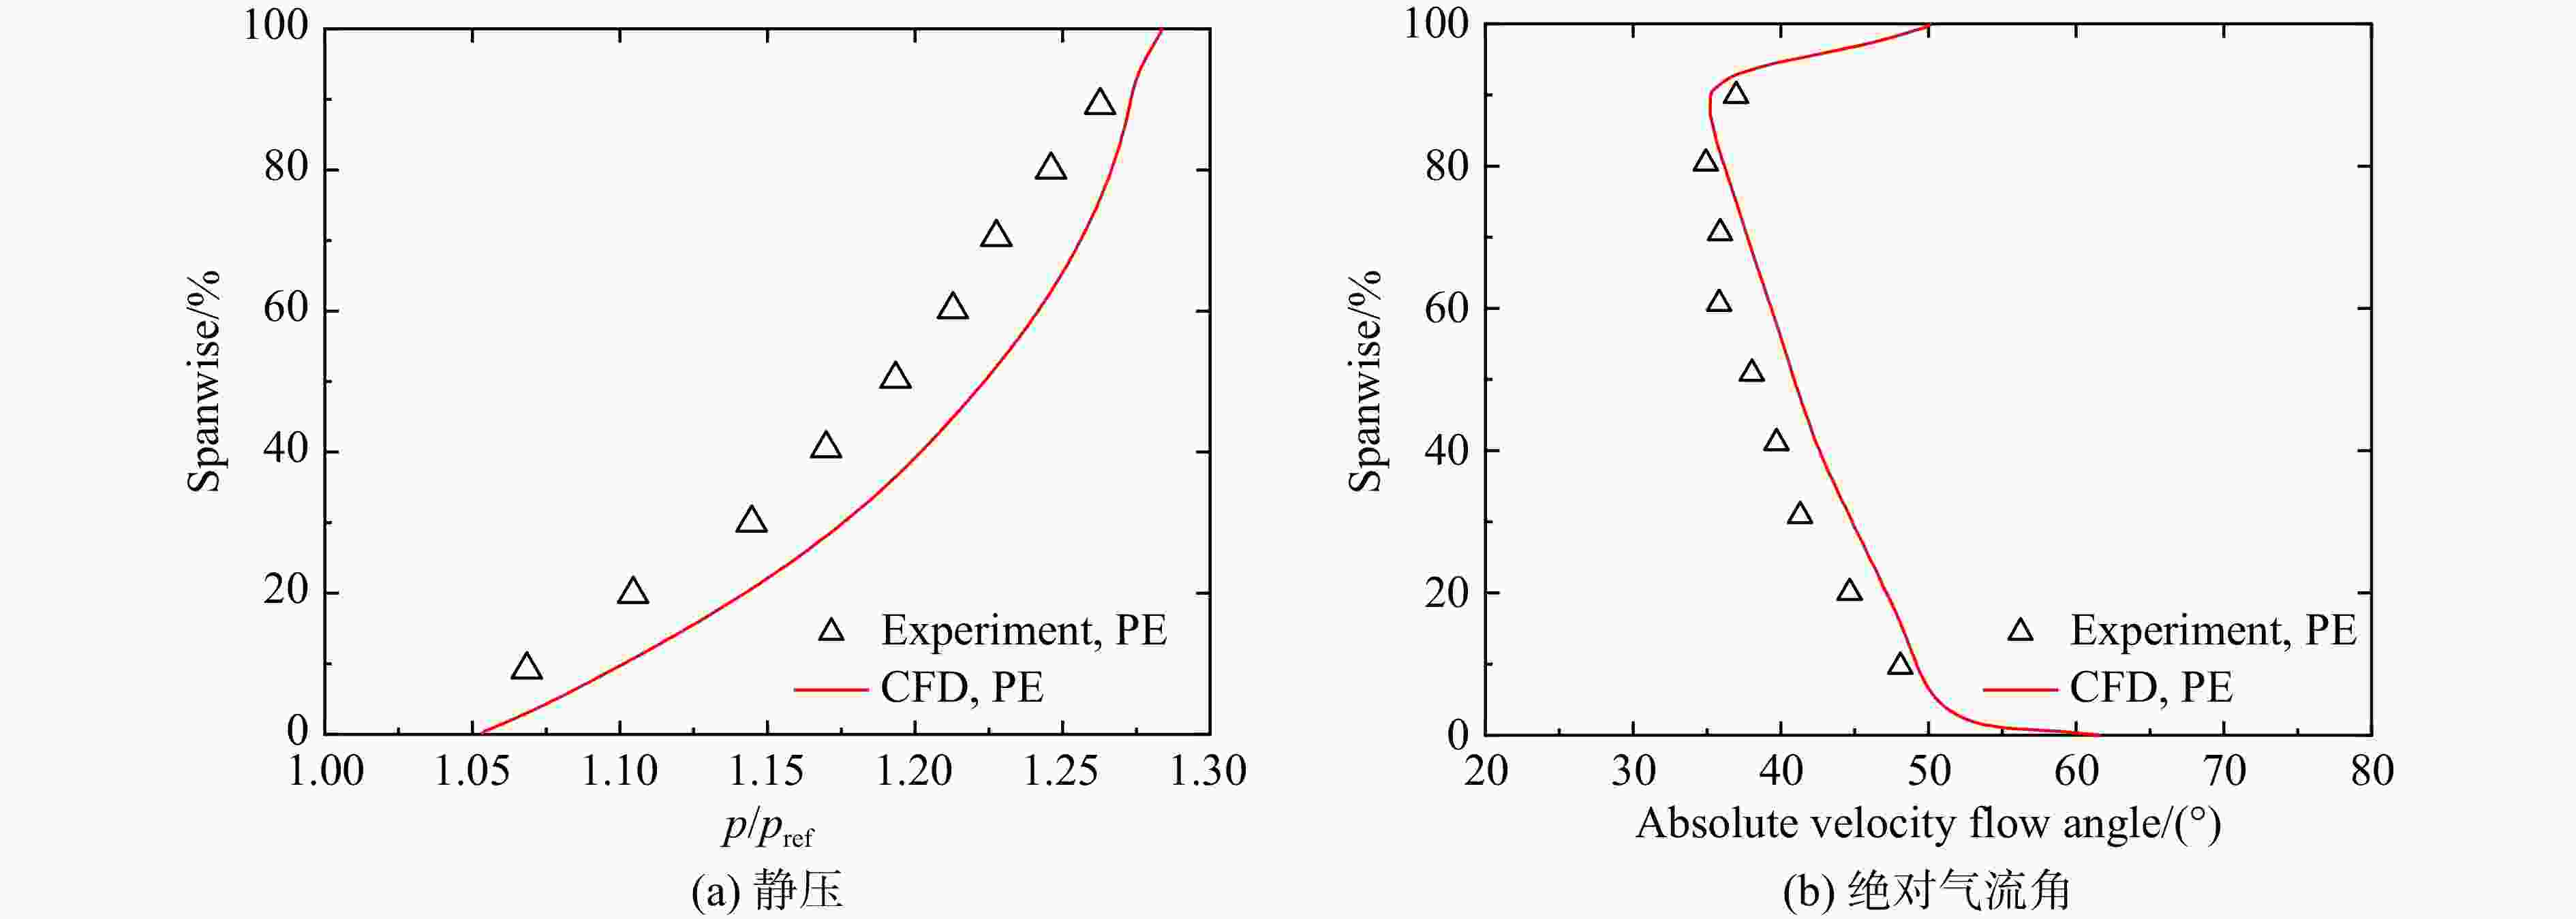
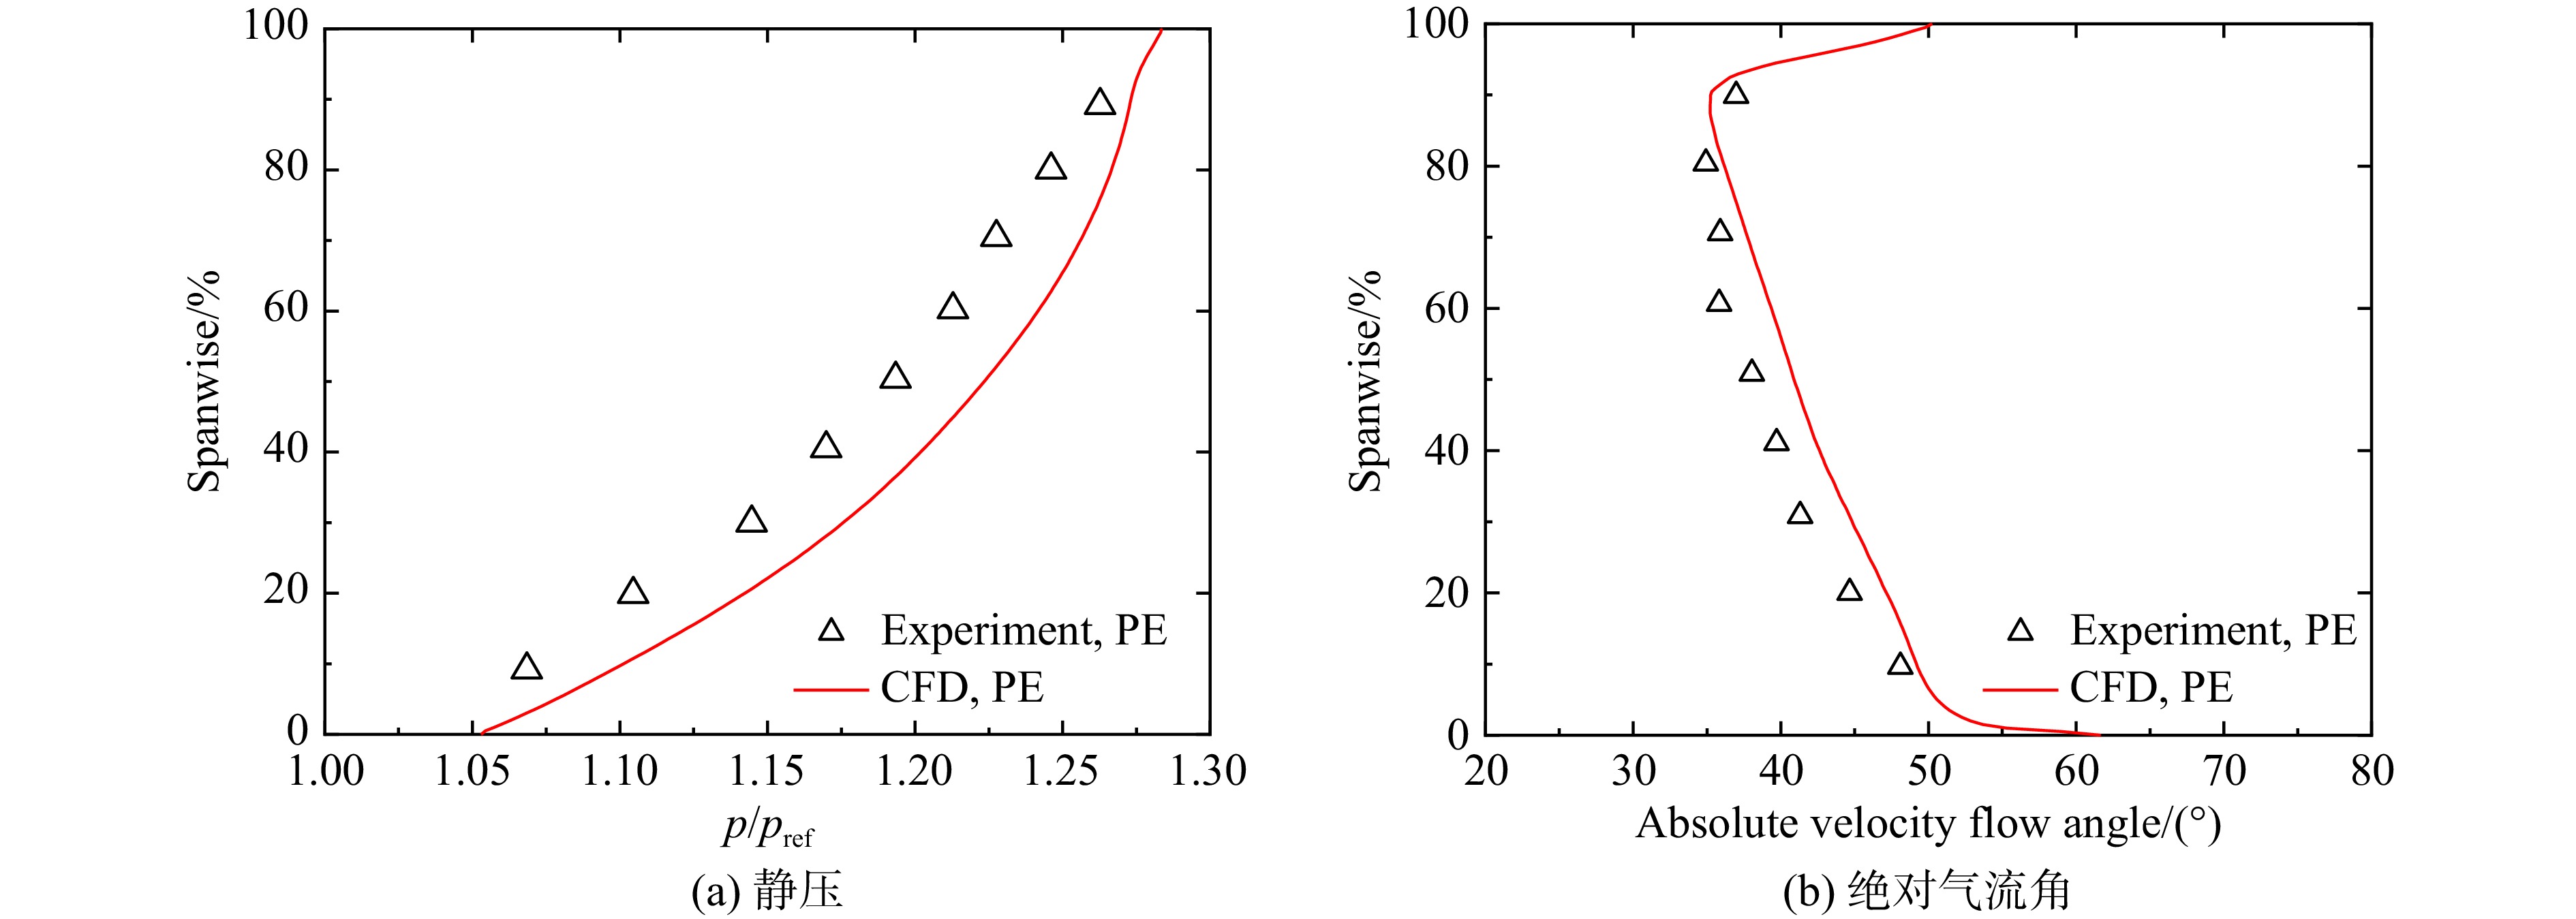
图 6 转子出口静压及绝对气流角径向分布
Figure 6. Static pressure and absolute velocity flow angle spanwise distribution of the prototype model downstream flow field parameters
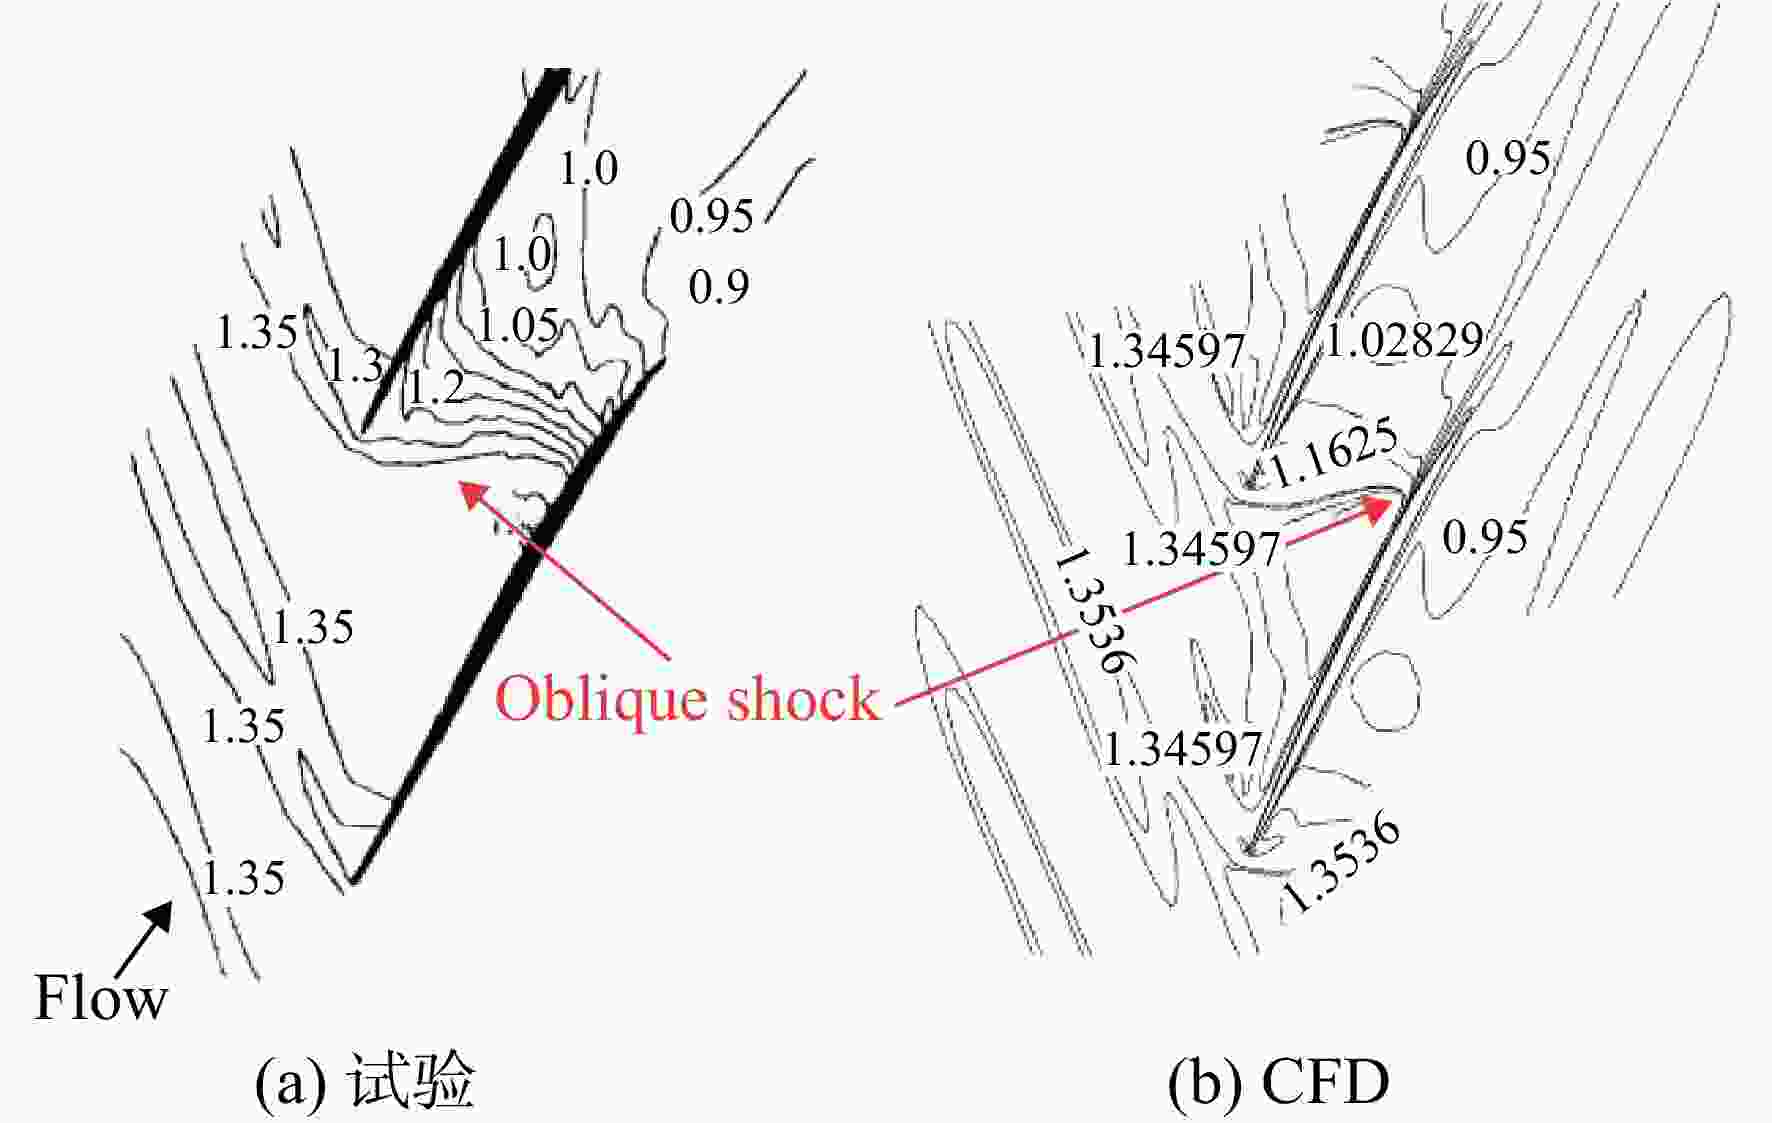
图 7 近最高效率点90%叶高相对马赫数云图
Figure 7. Comparisons of the relative Mach number at 90% spanwise near PE
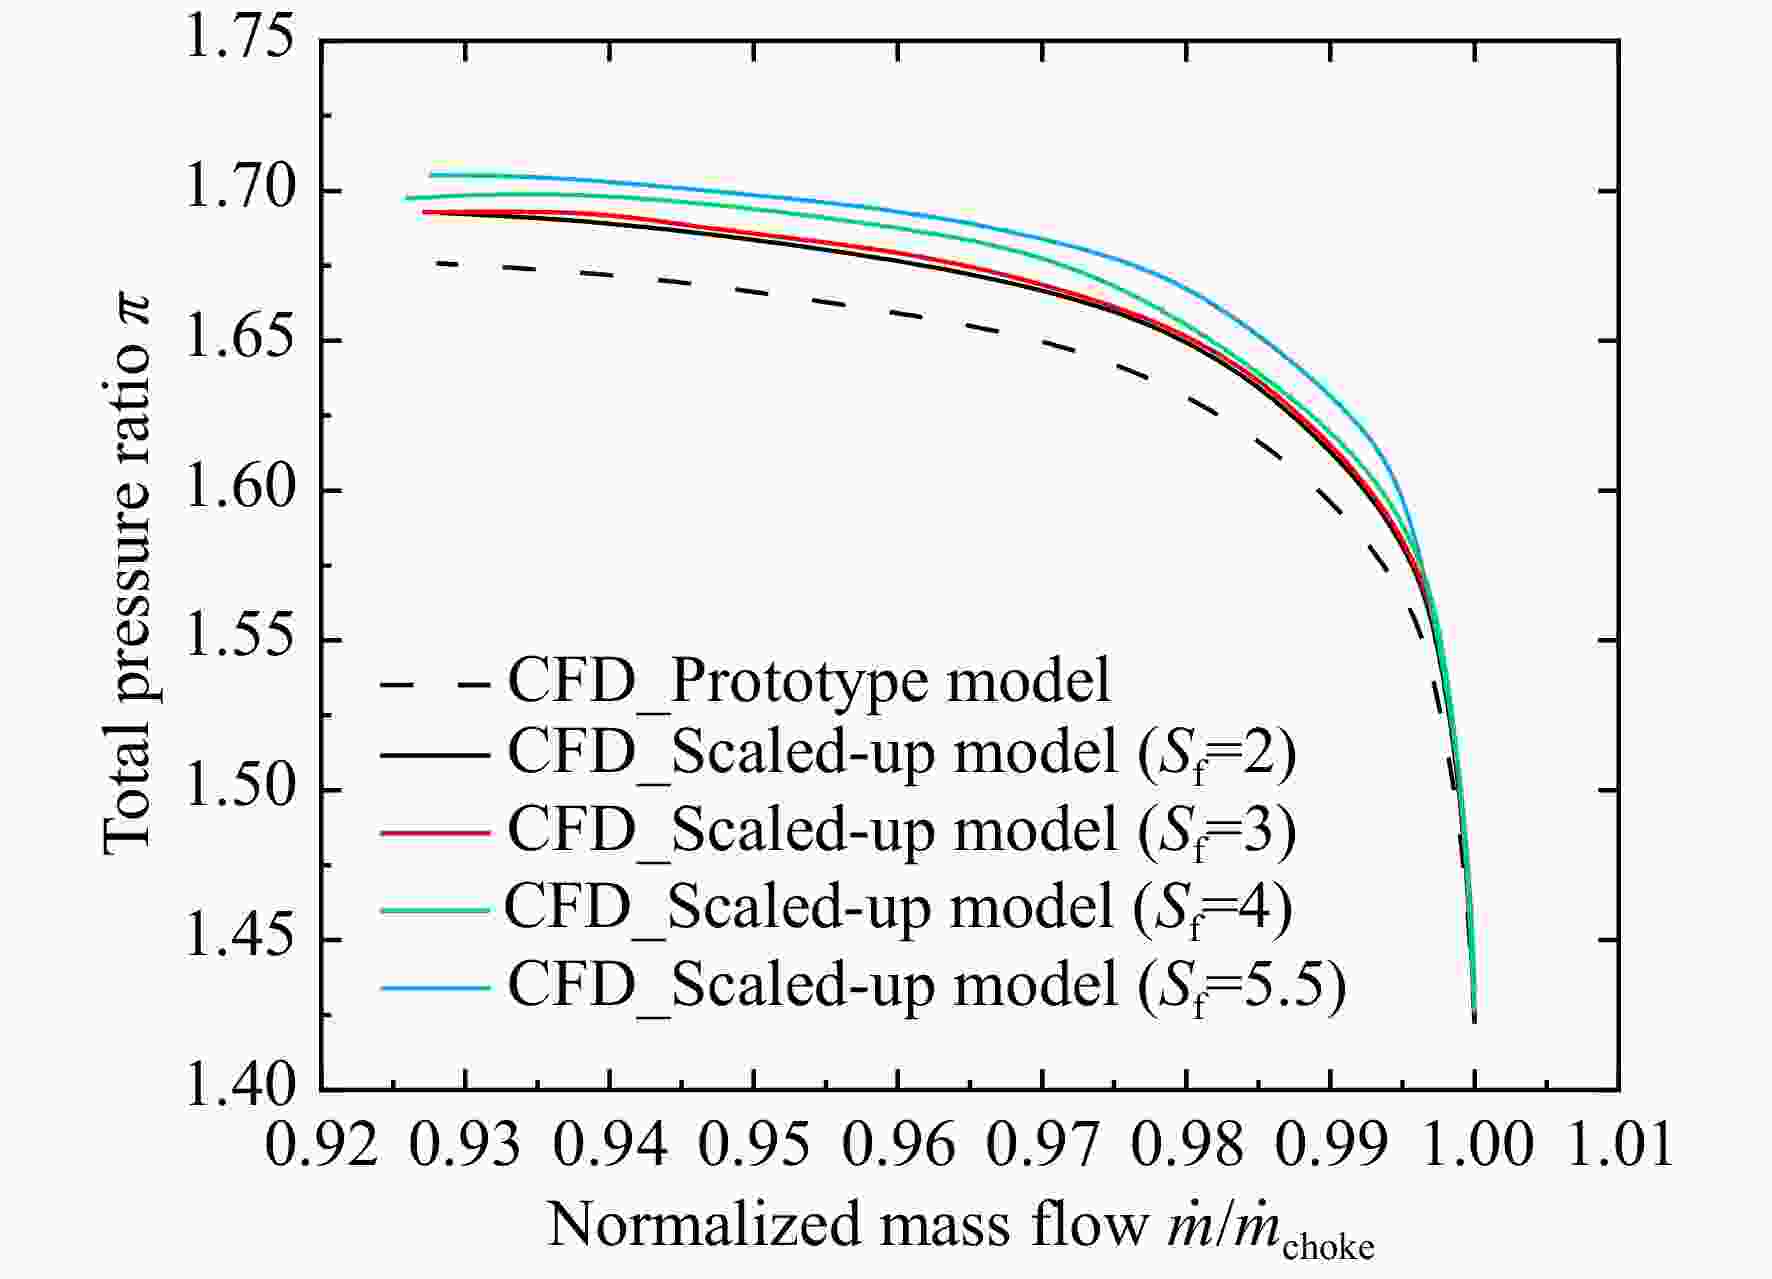
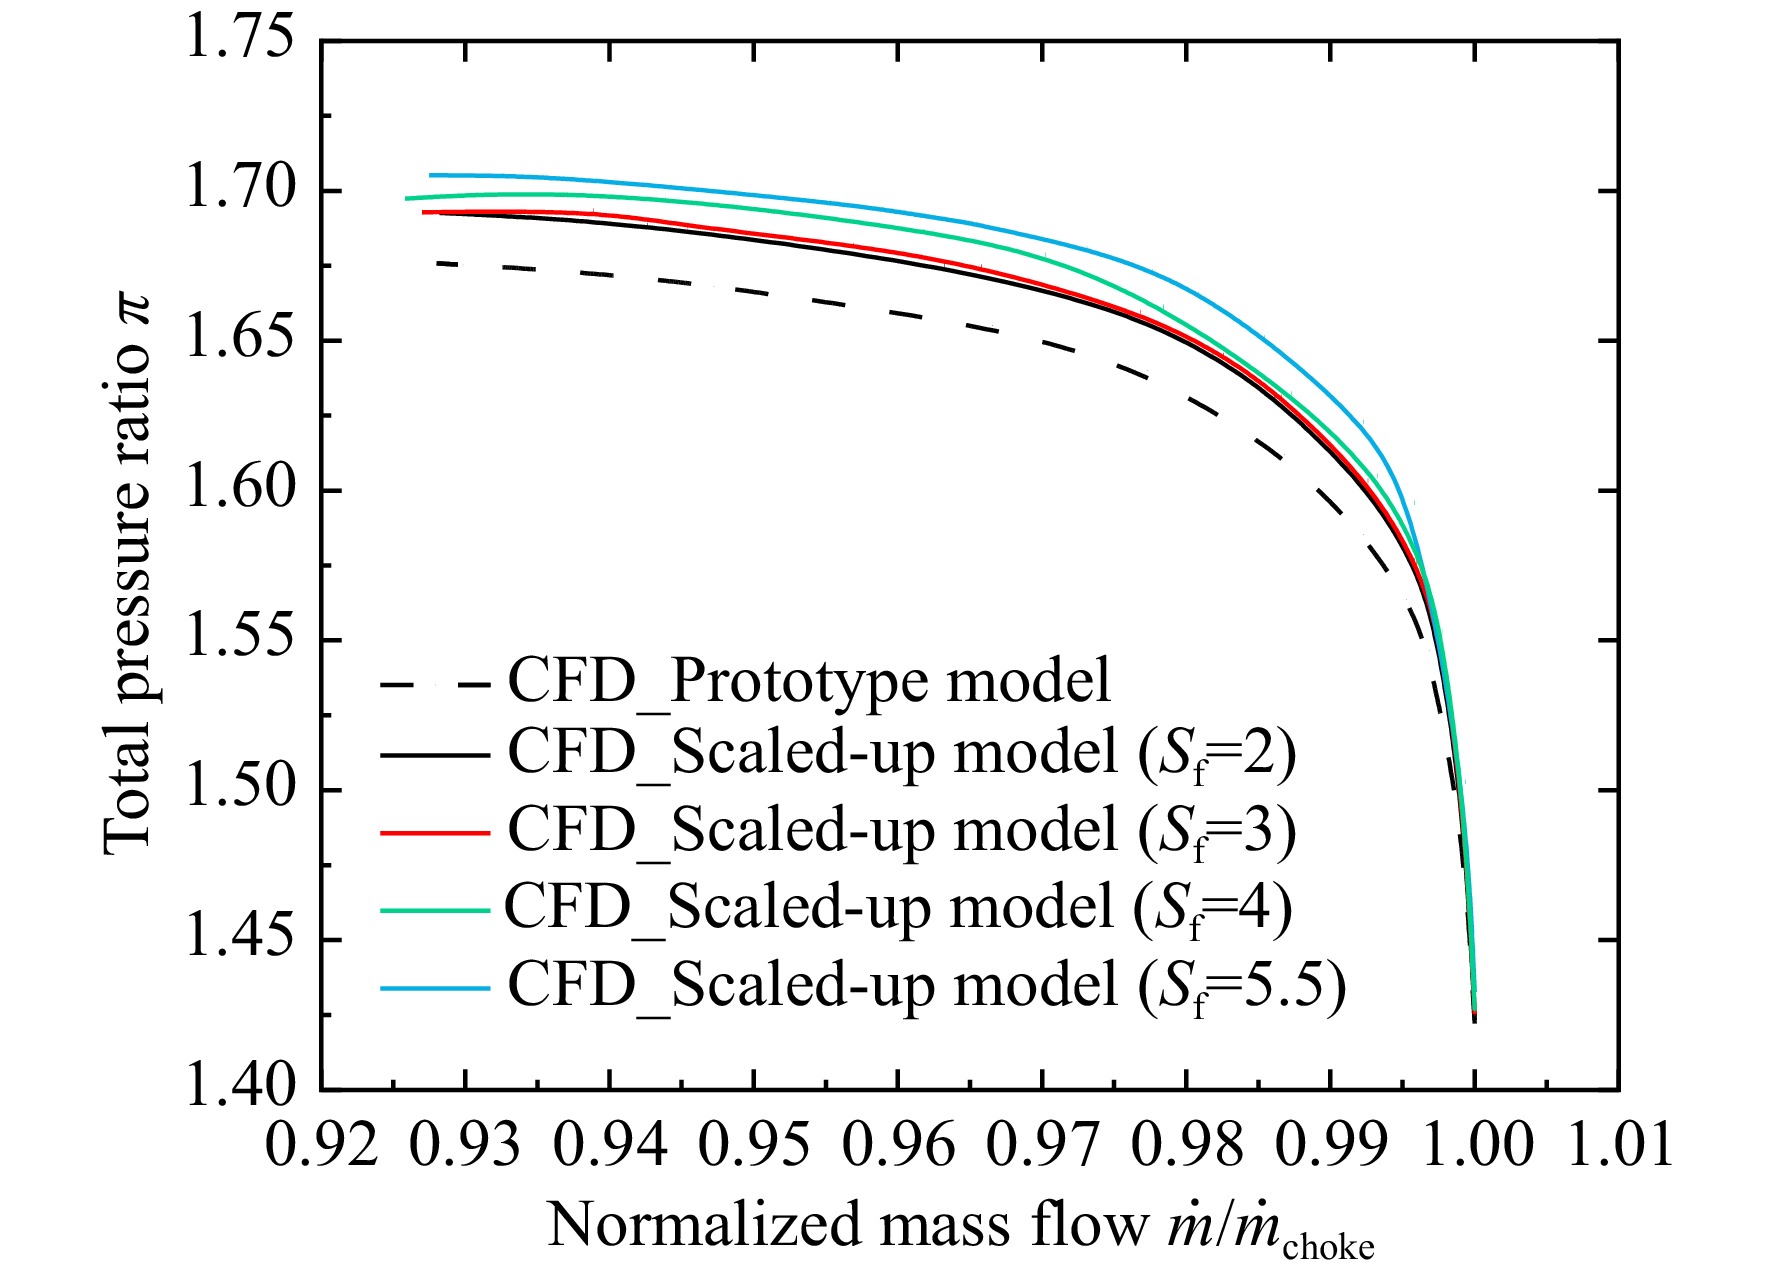
图 8 小/大模型流量-总压比
Figure 8. Comparison of mass flow-total pressure ratio performance curves between the prototype and scaled-up model
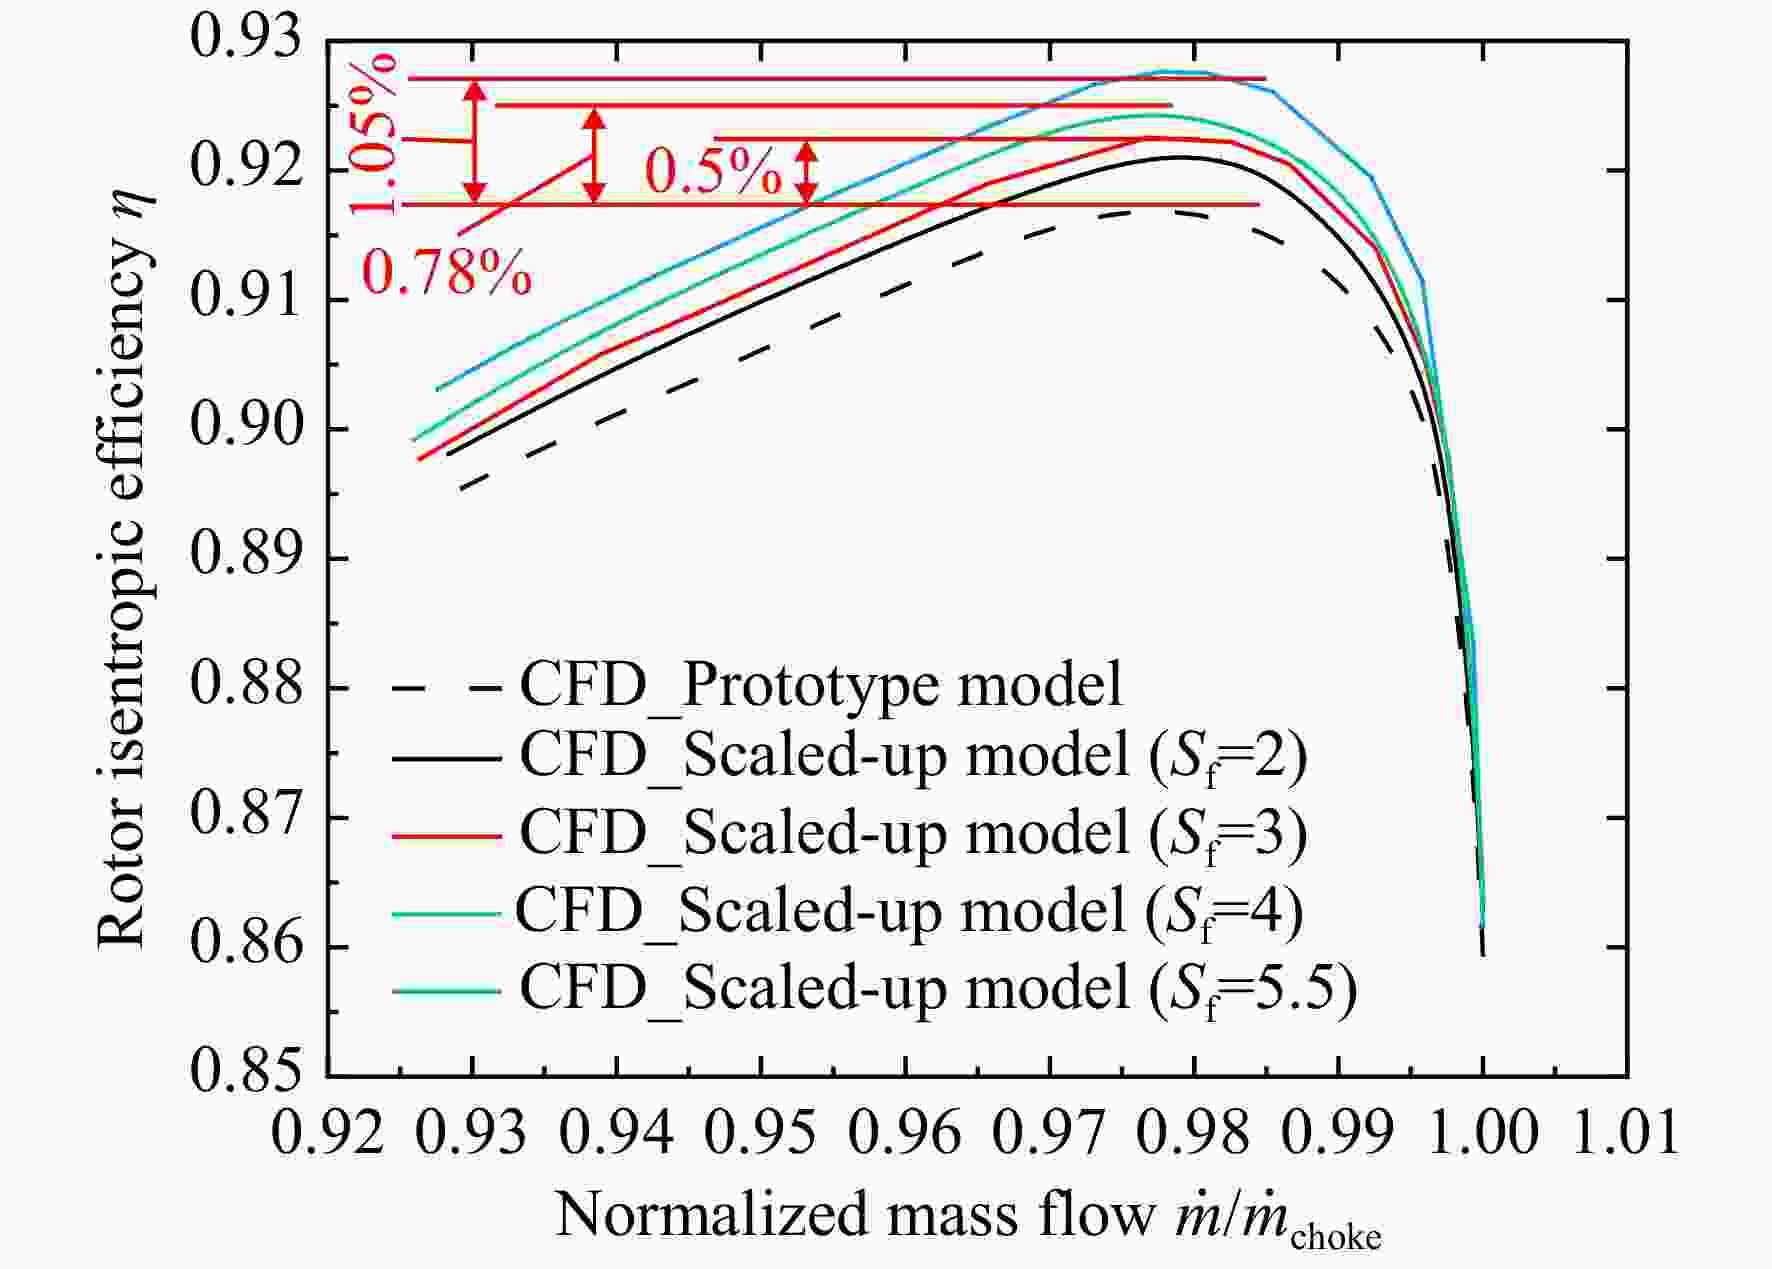
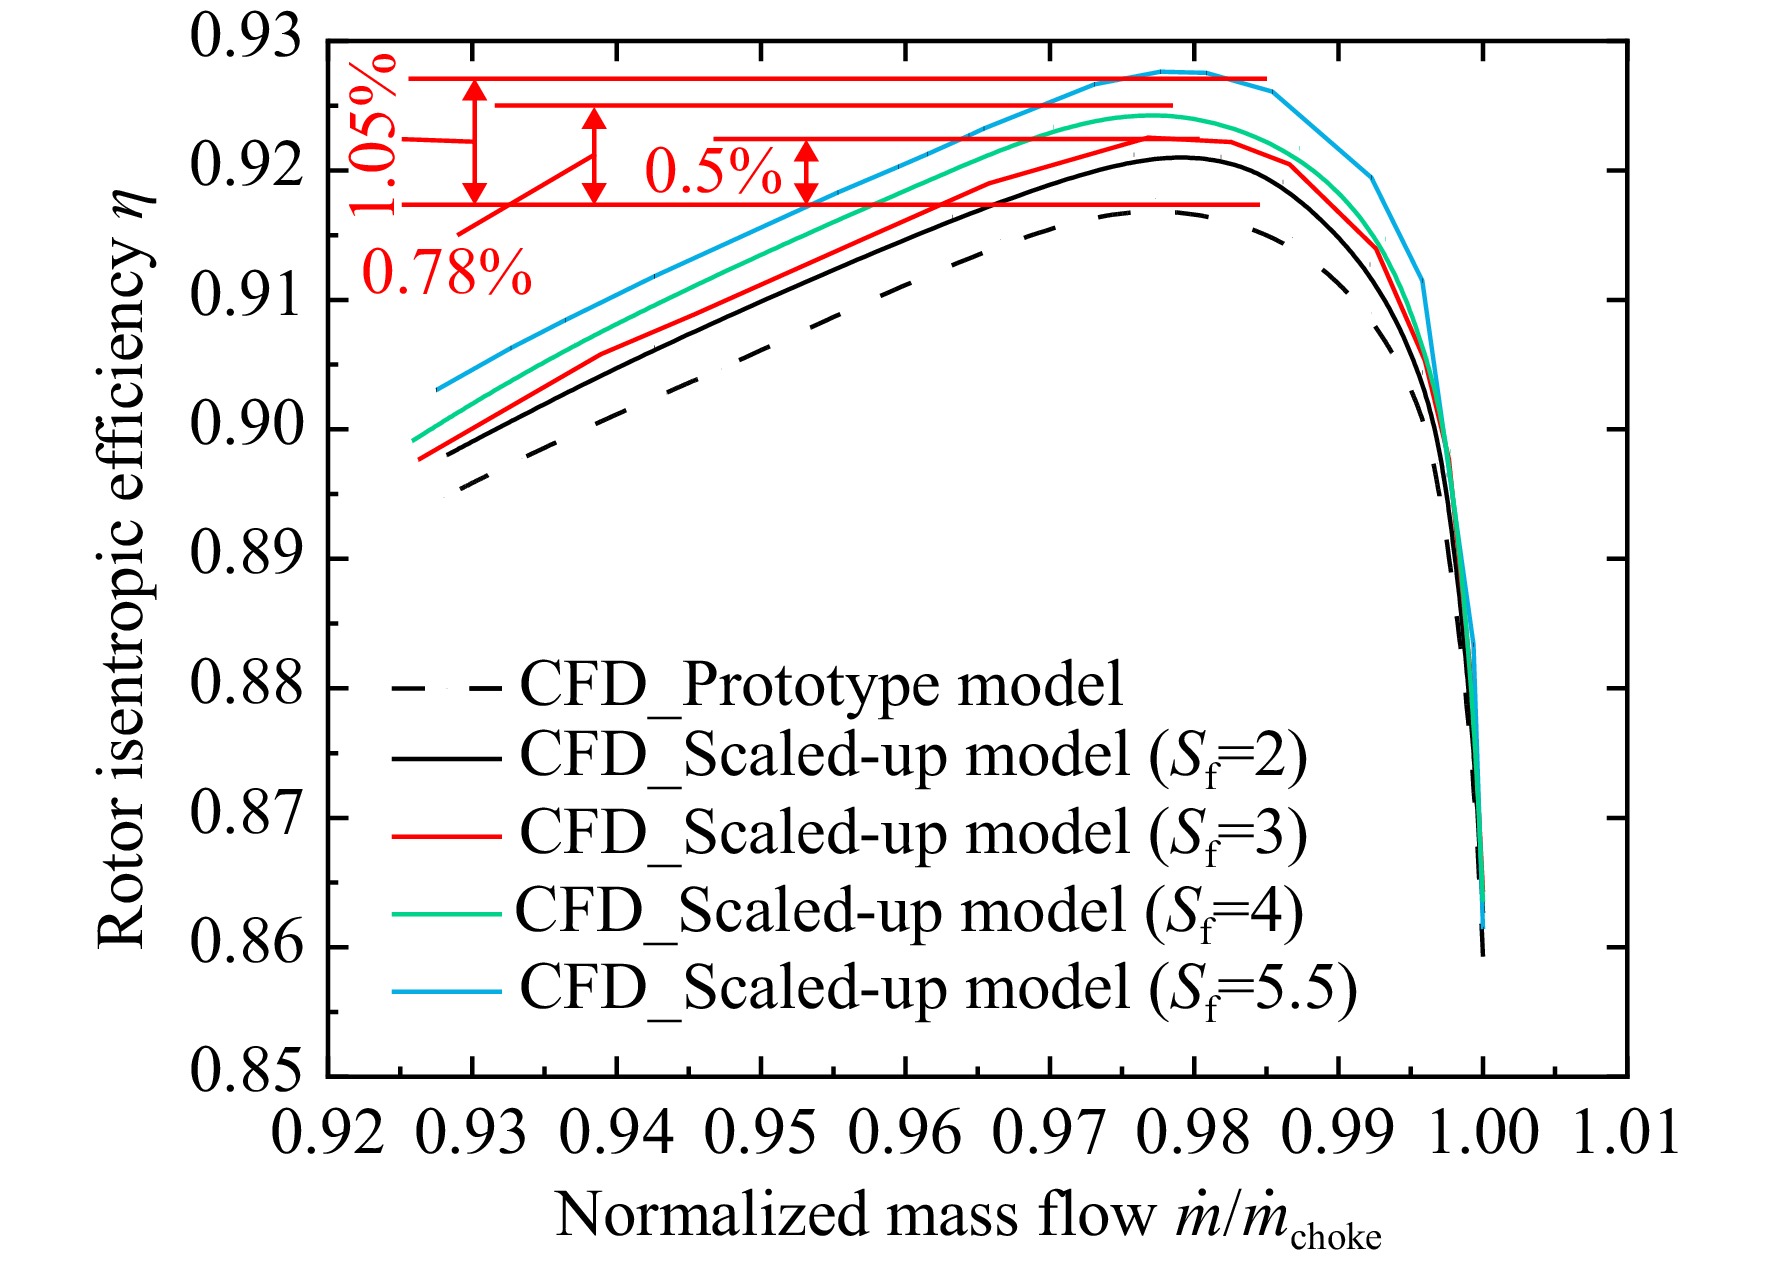
图 9 小/大模型流量-等熵效率
Figure 9. Comparison of mass flow-isentropic efficiency performance curves between the prototype and scaled-up model
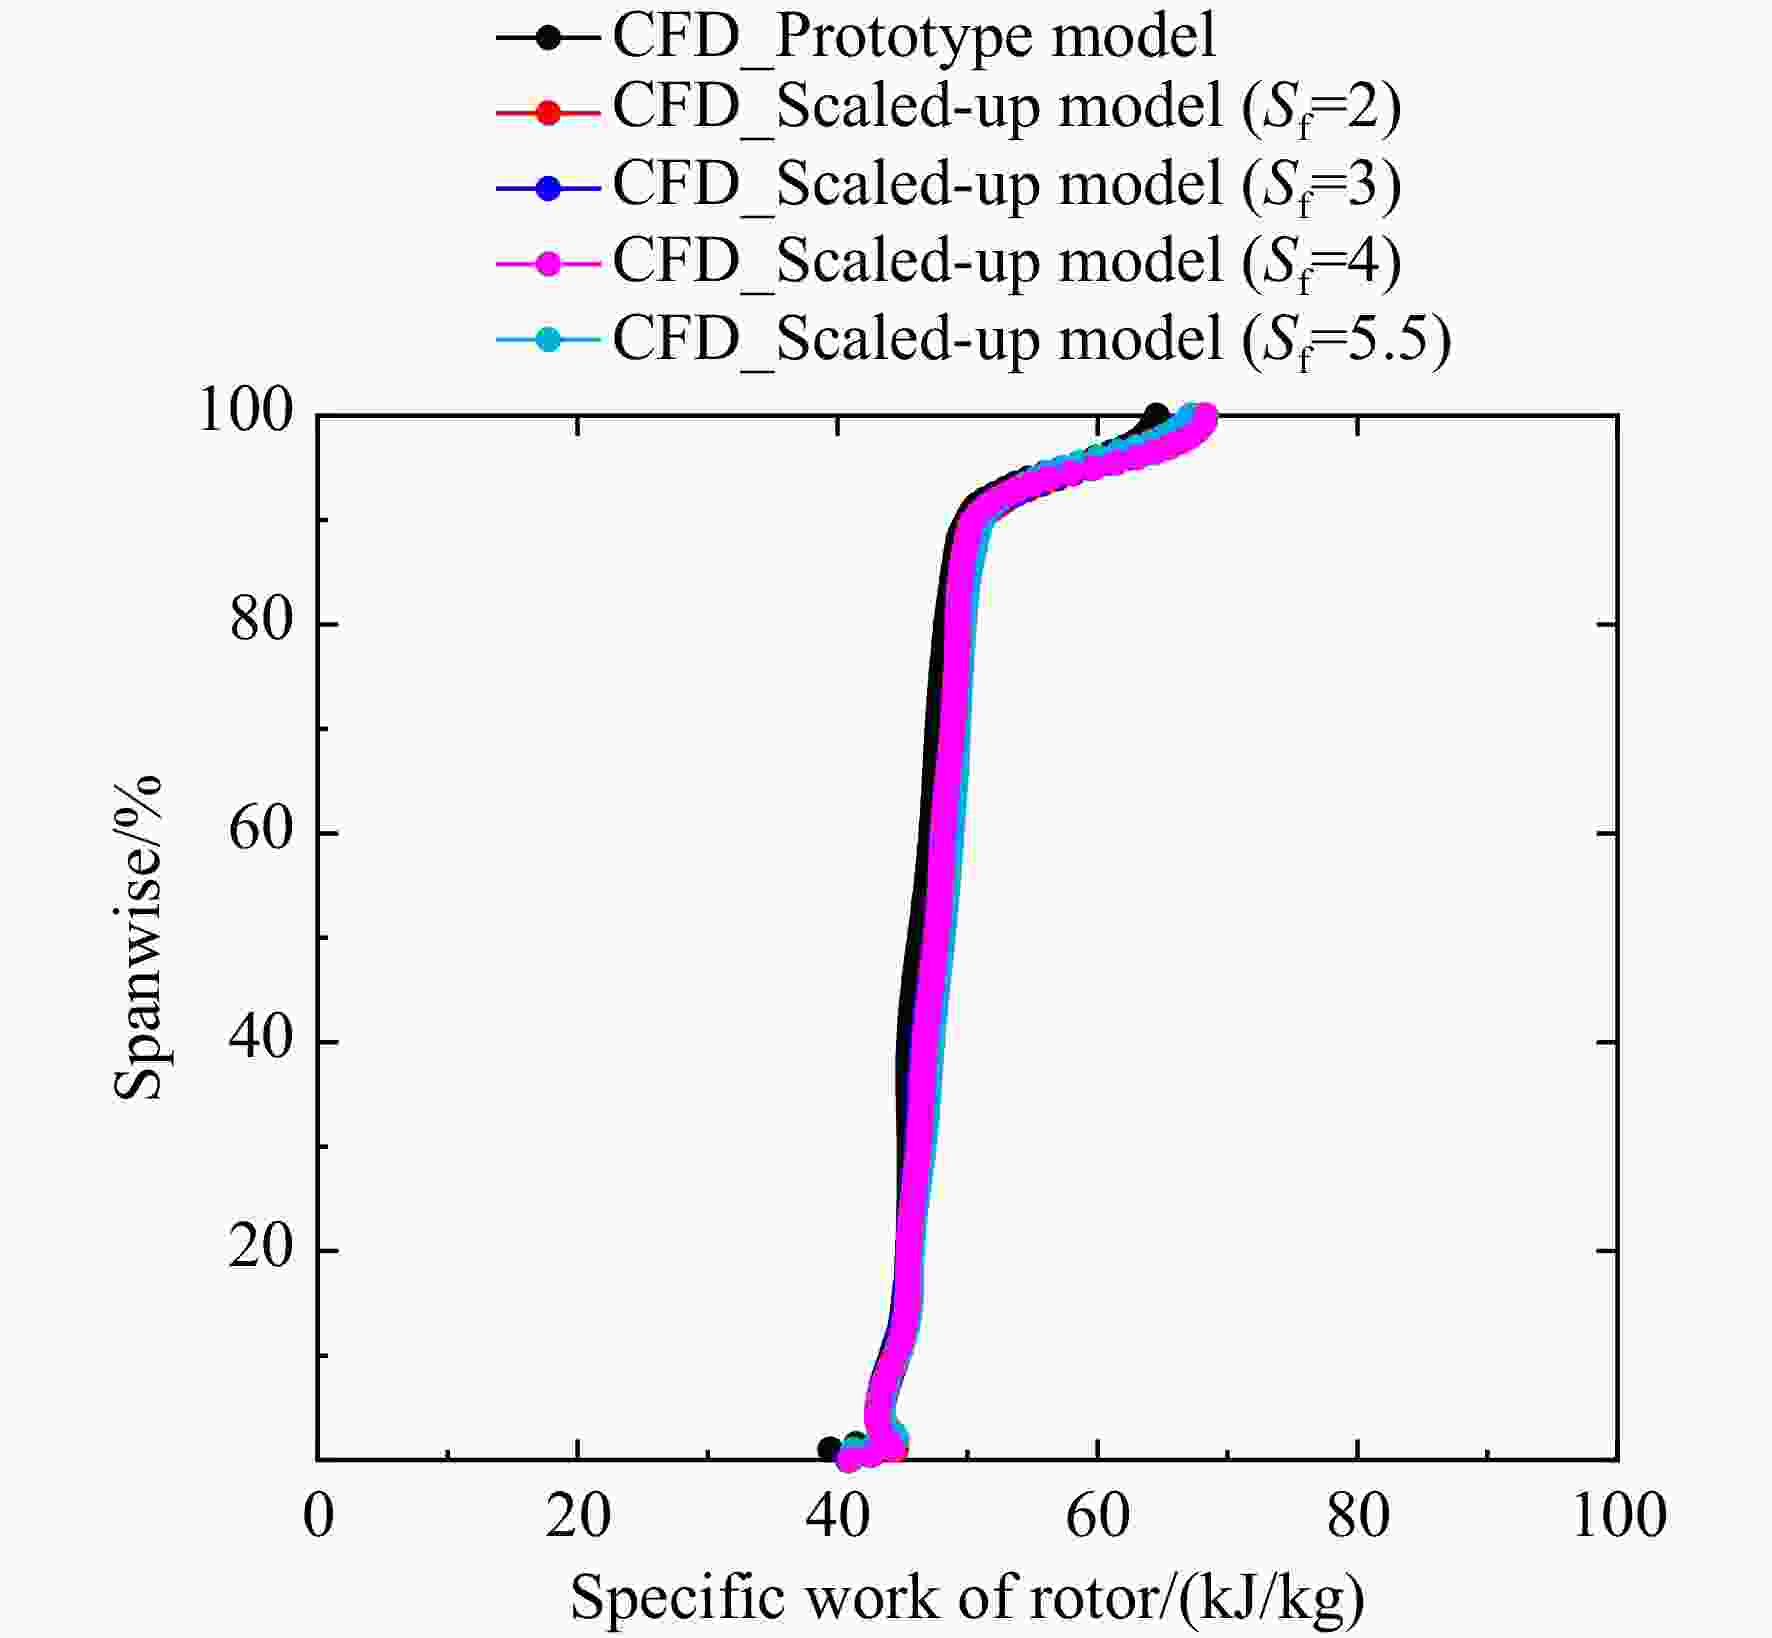
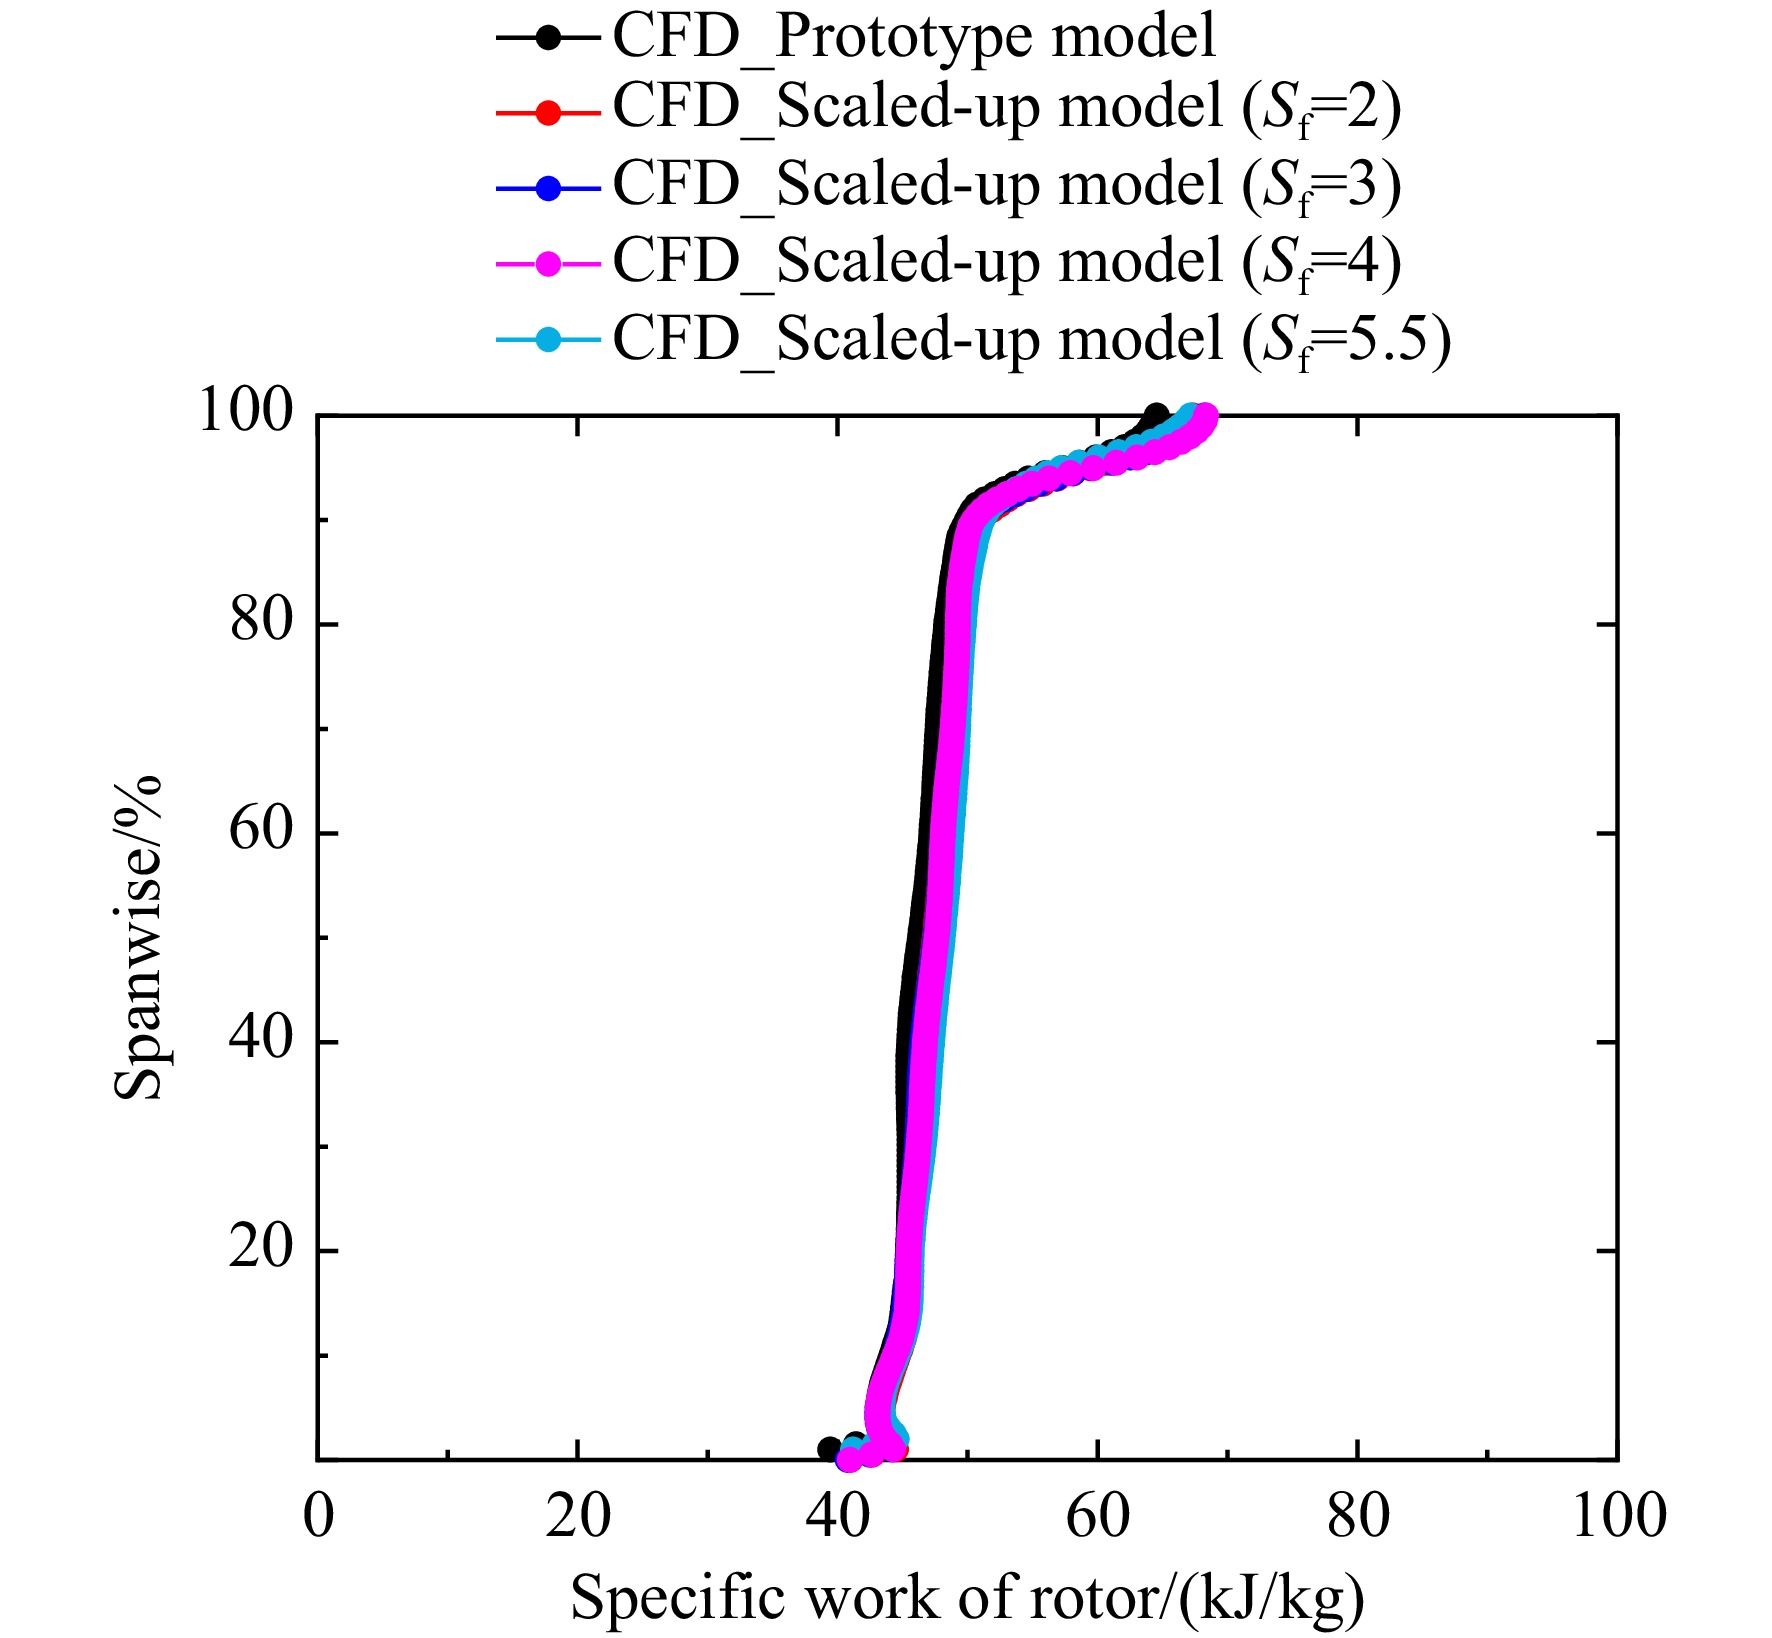
图 10 小/大模型轮缘功径向分布
Figure 10. Comparison of specific work spanwise distribution between the prototype and scaled-up model
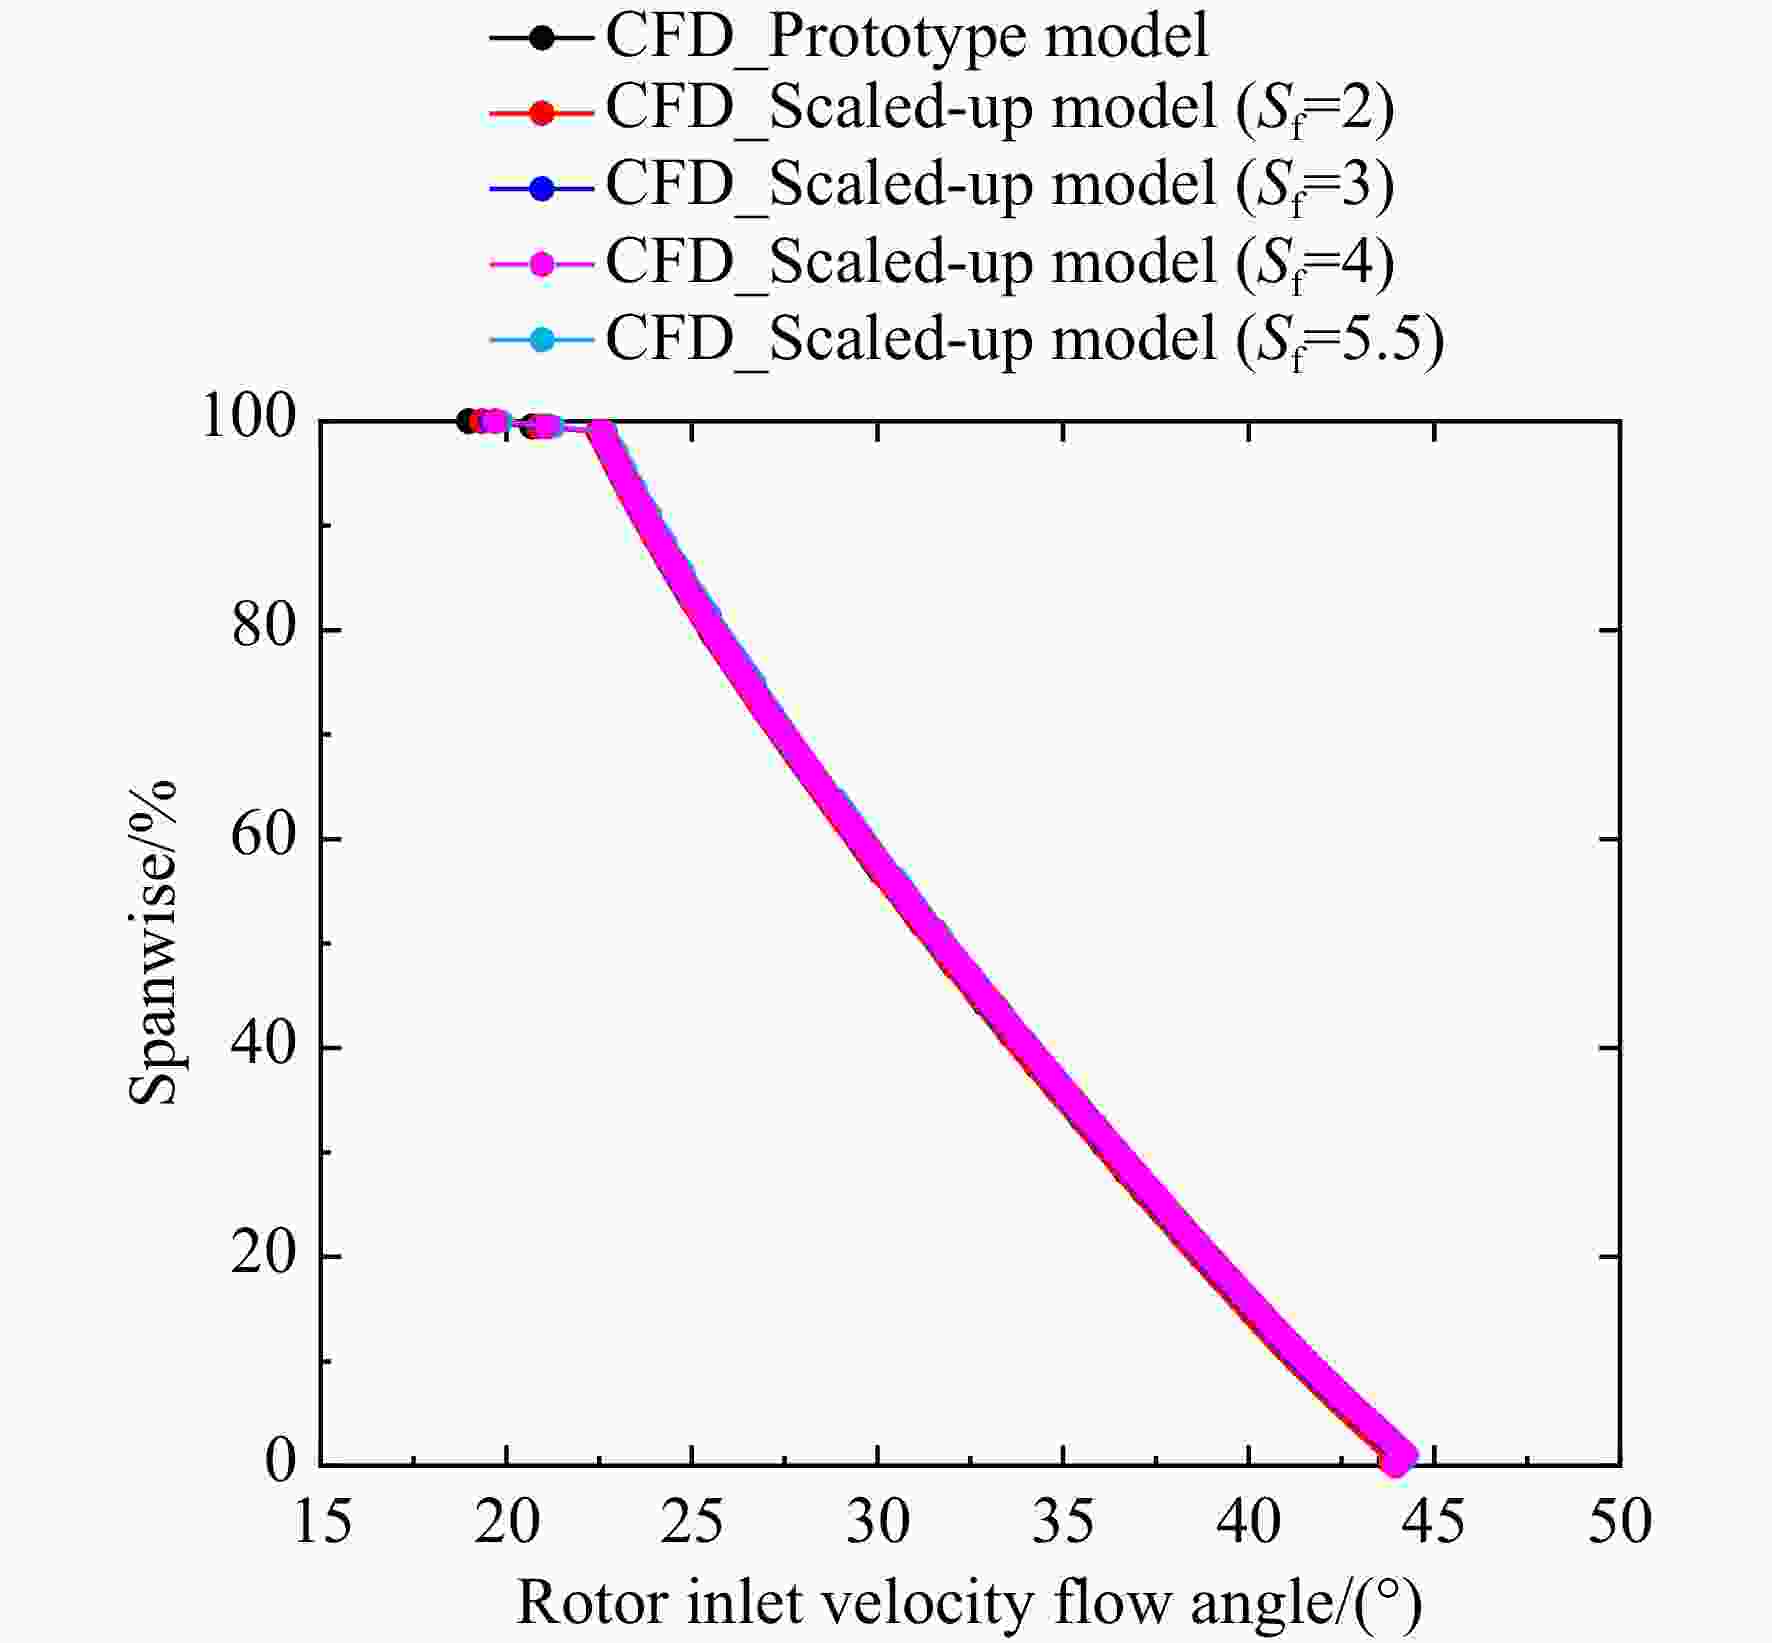
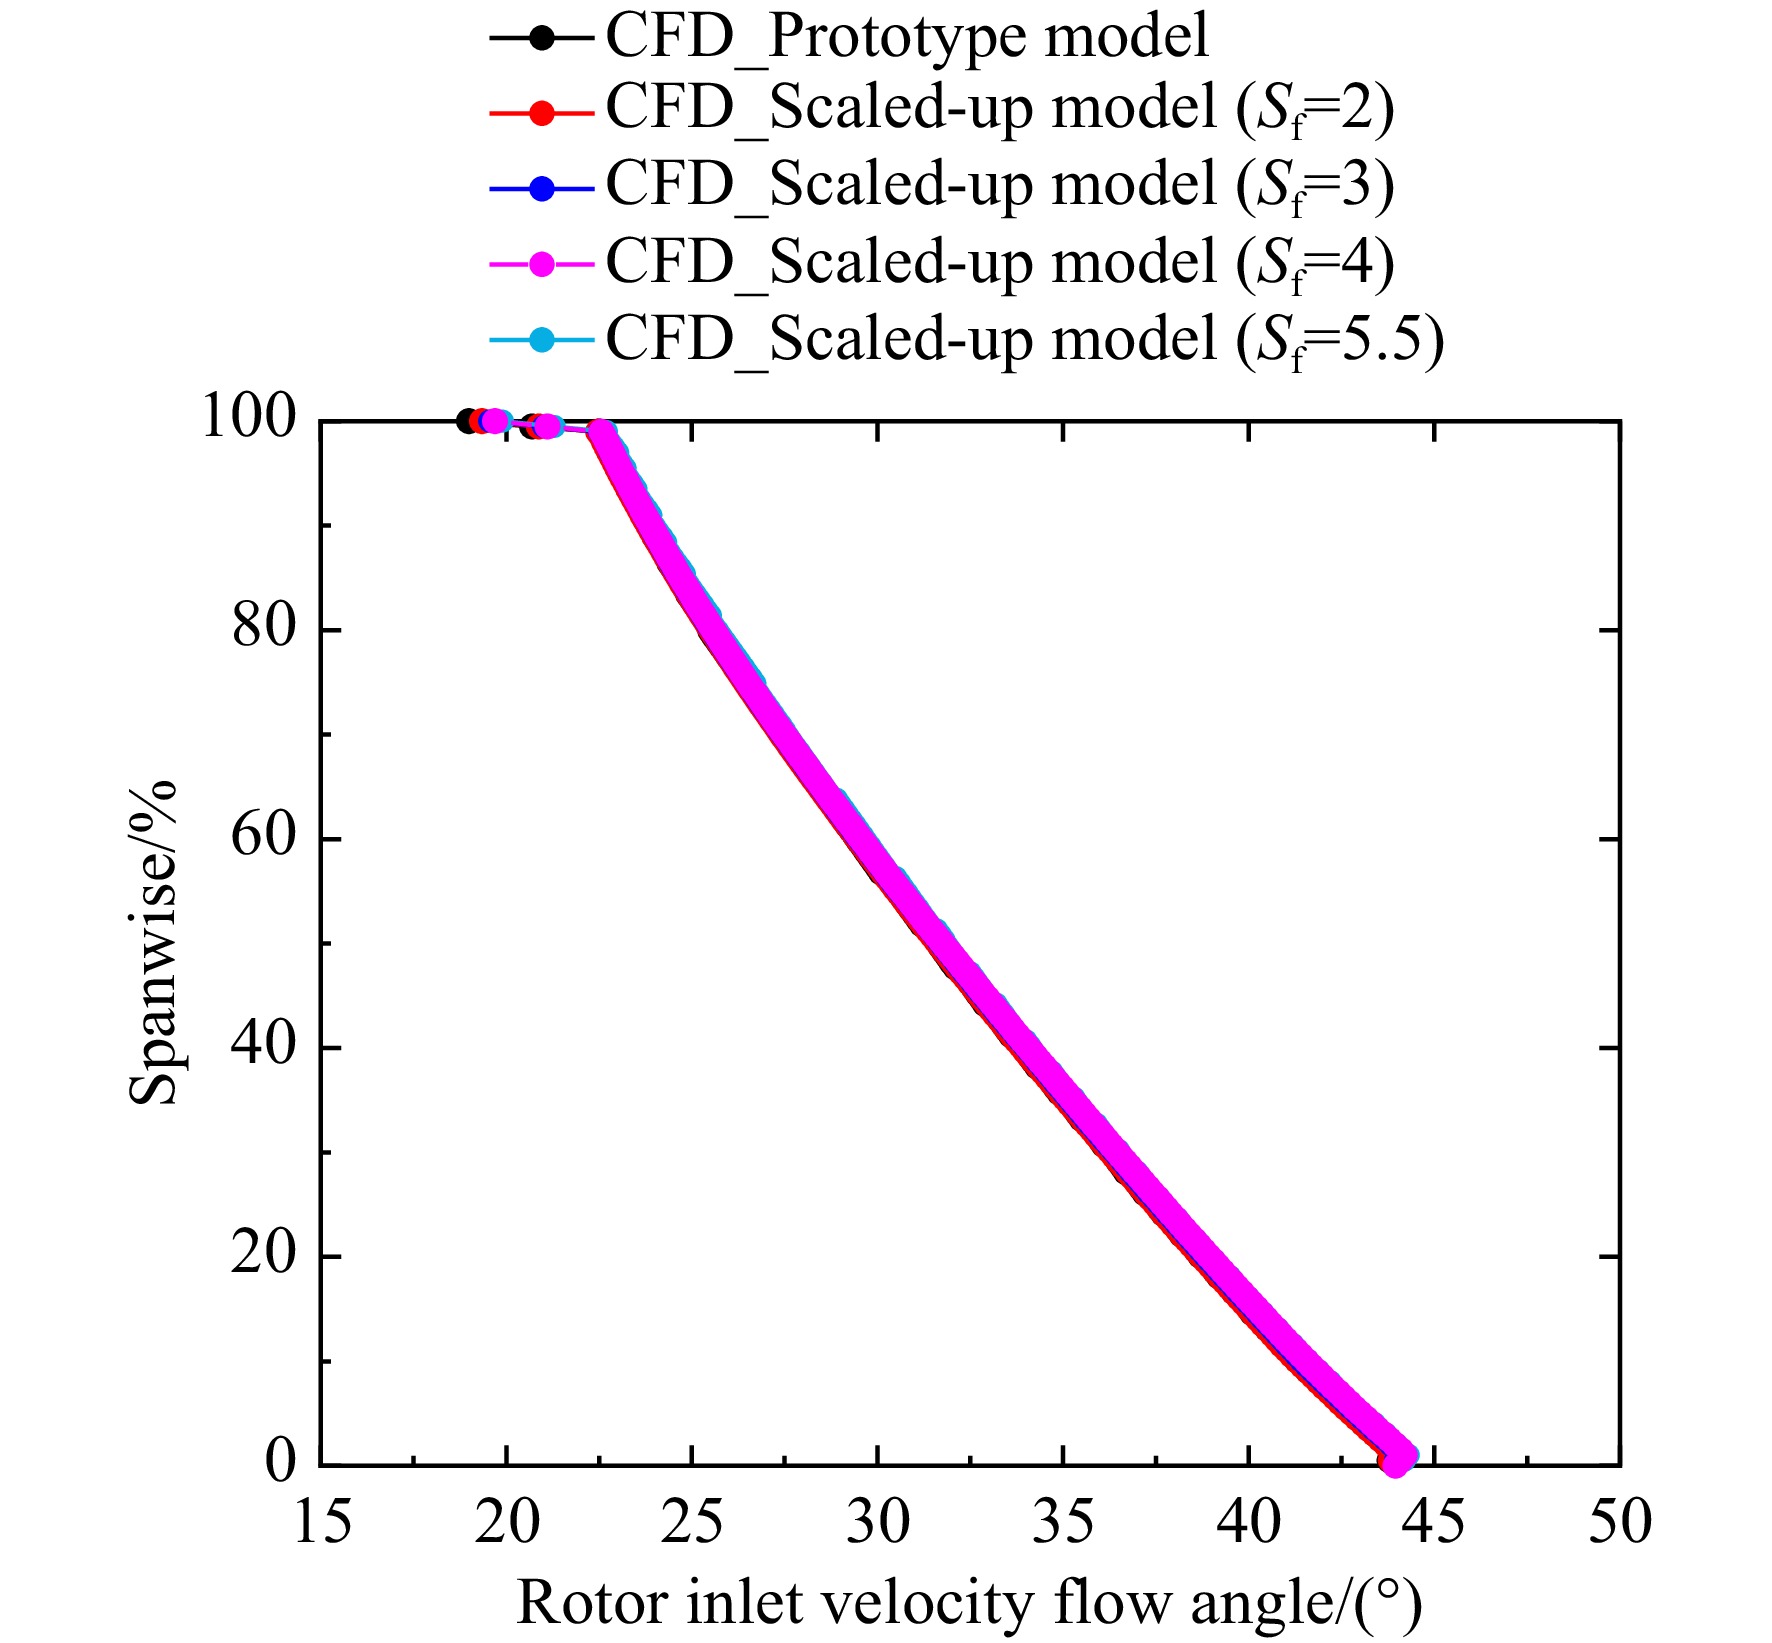
图 11 小/大模型进口相对气流角沿径向分布对比
Figure 11. Comparison of inlet relative flow angle spanwise distribution between the prototype and scaled-up model
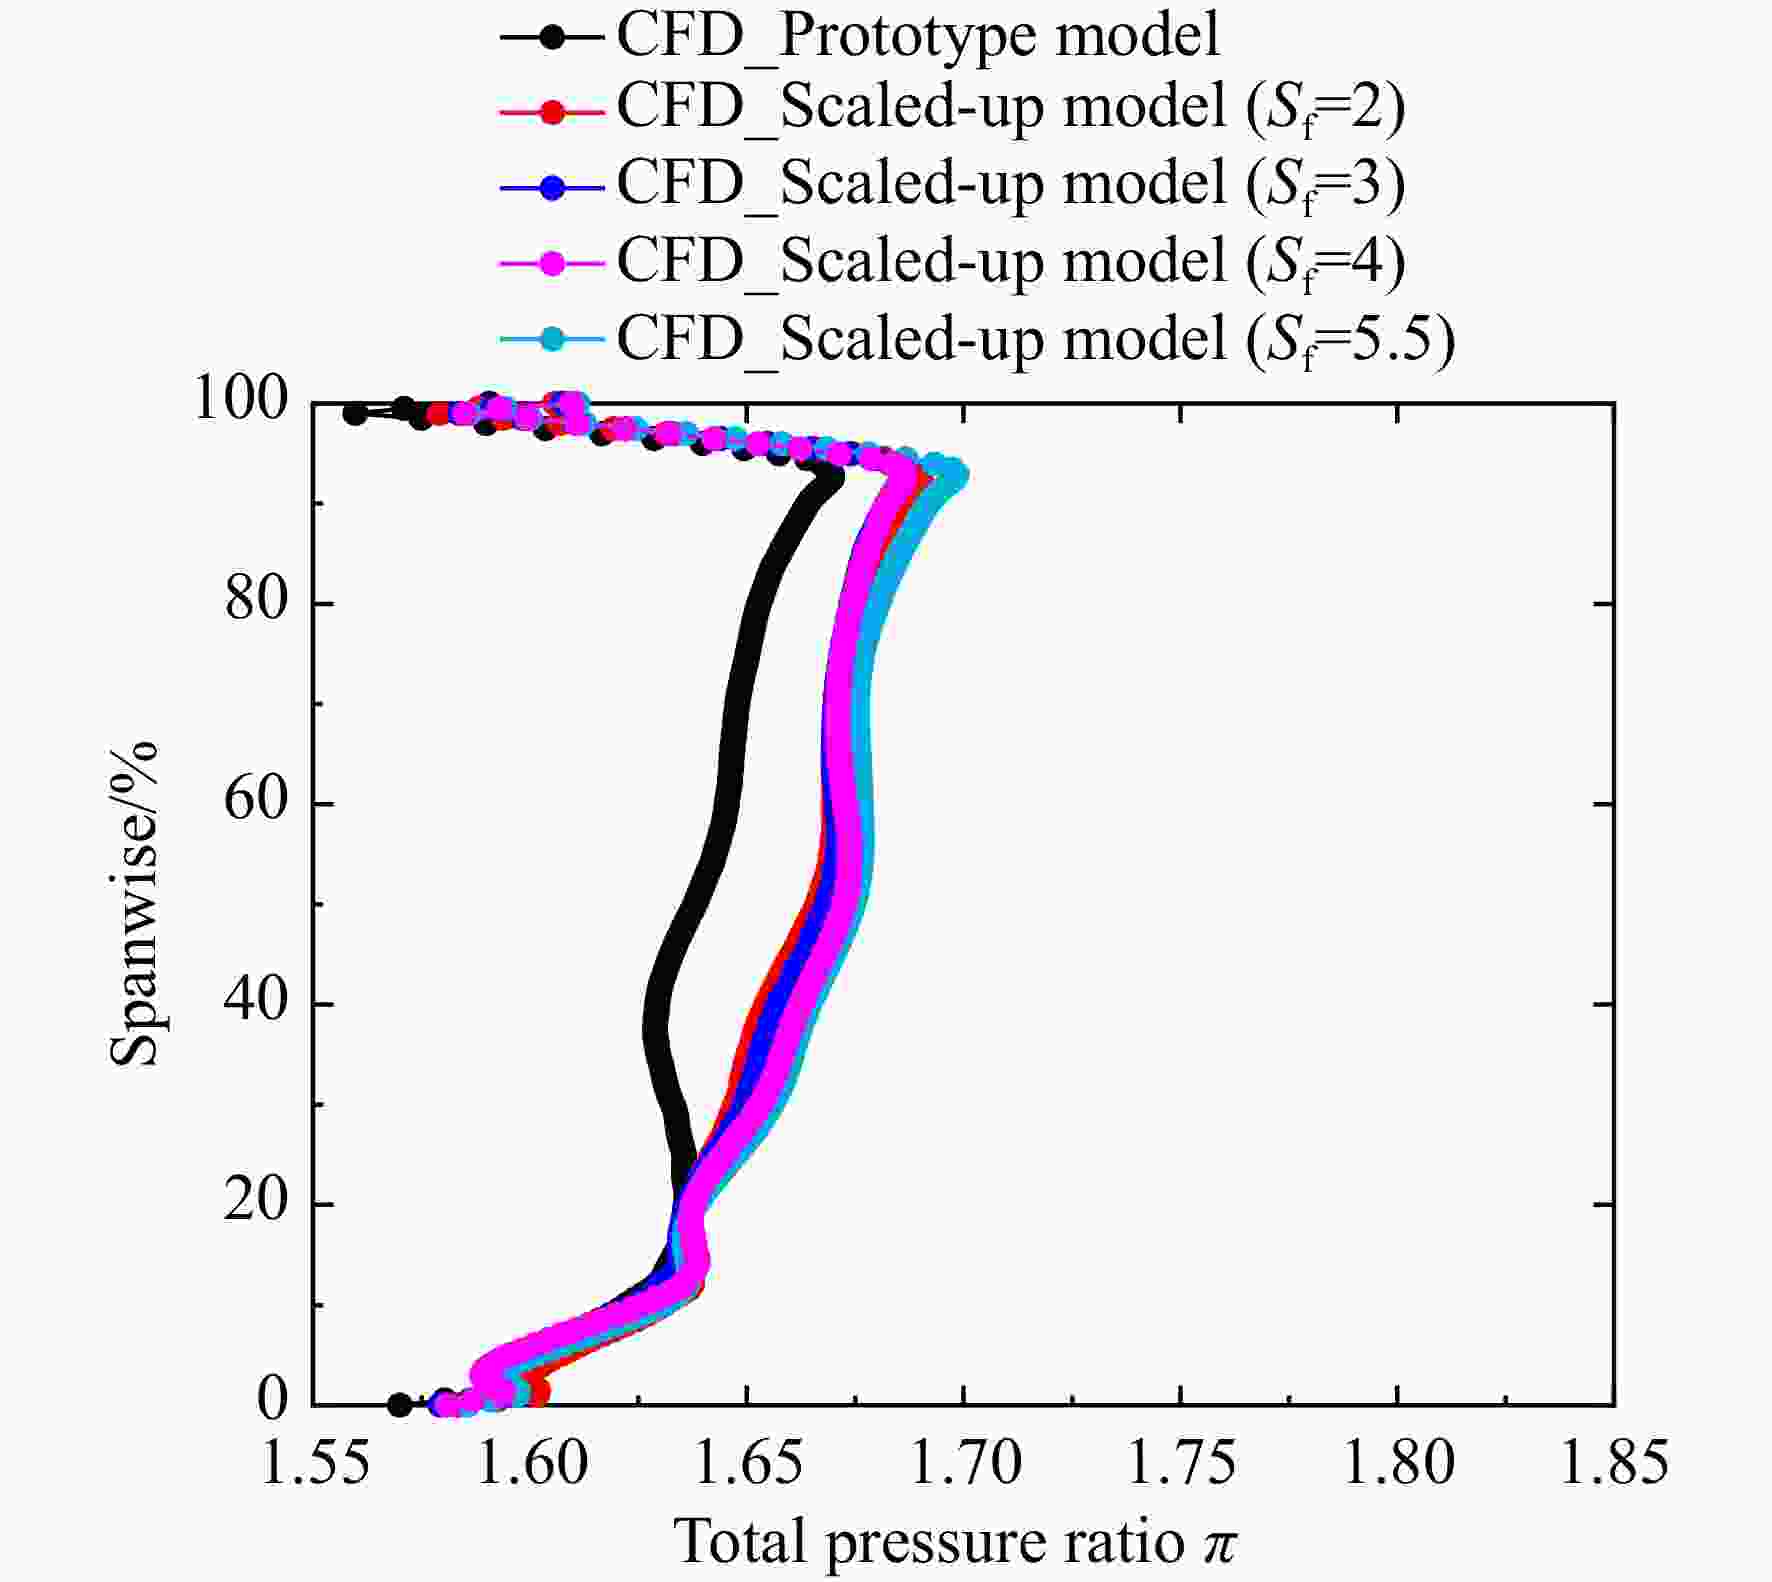
图 12 小/大模型总压比径向分布对比
Figure 12. Comparison of total pressure ratio spanwise distribution between the prototype and scaled-up model
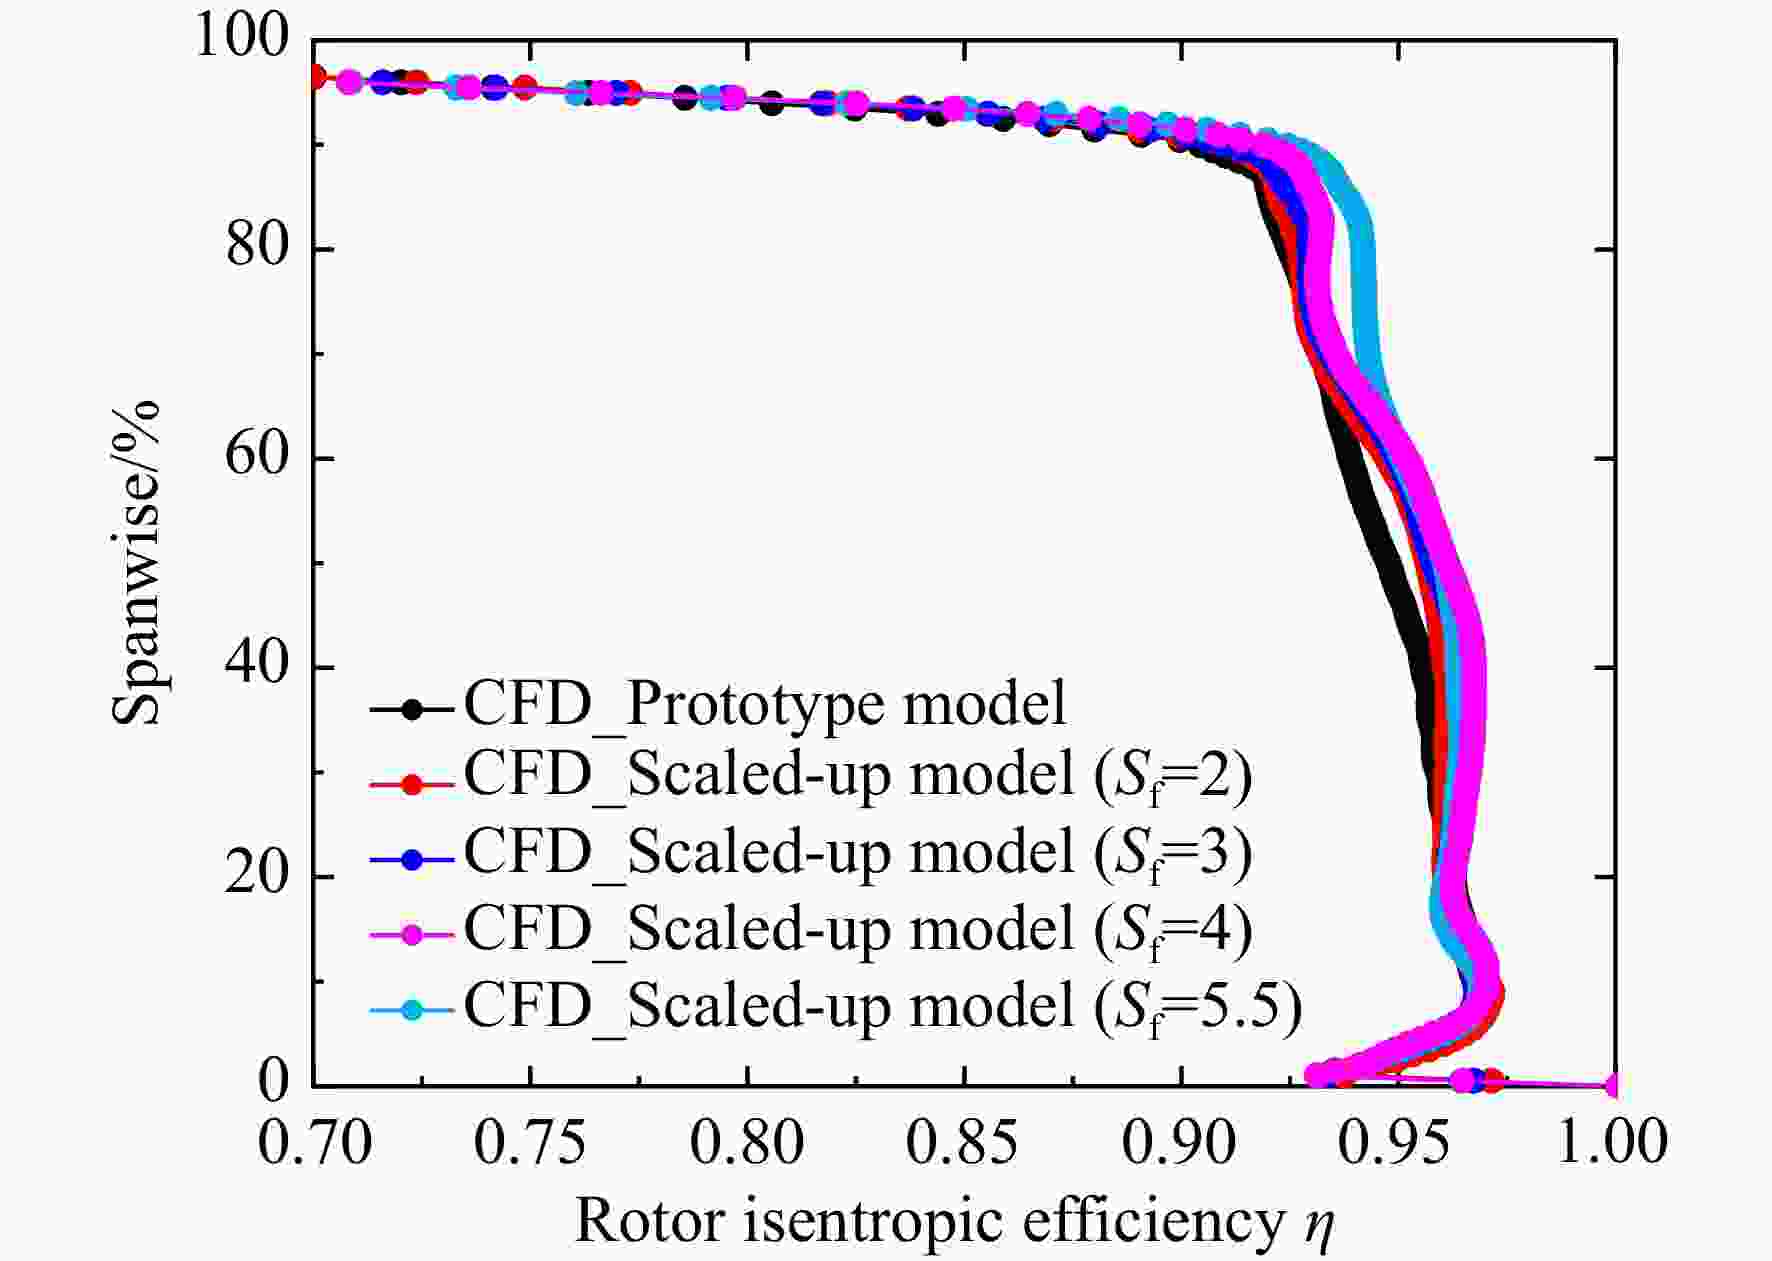
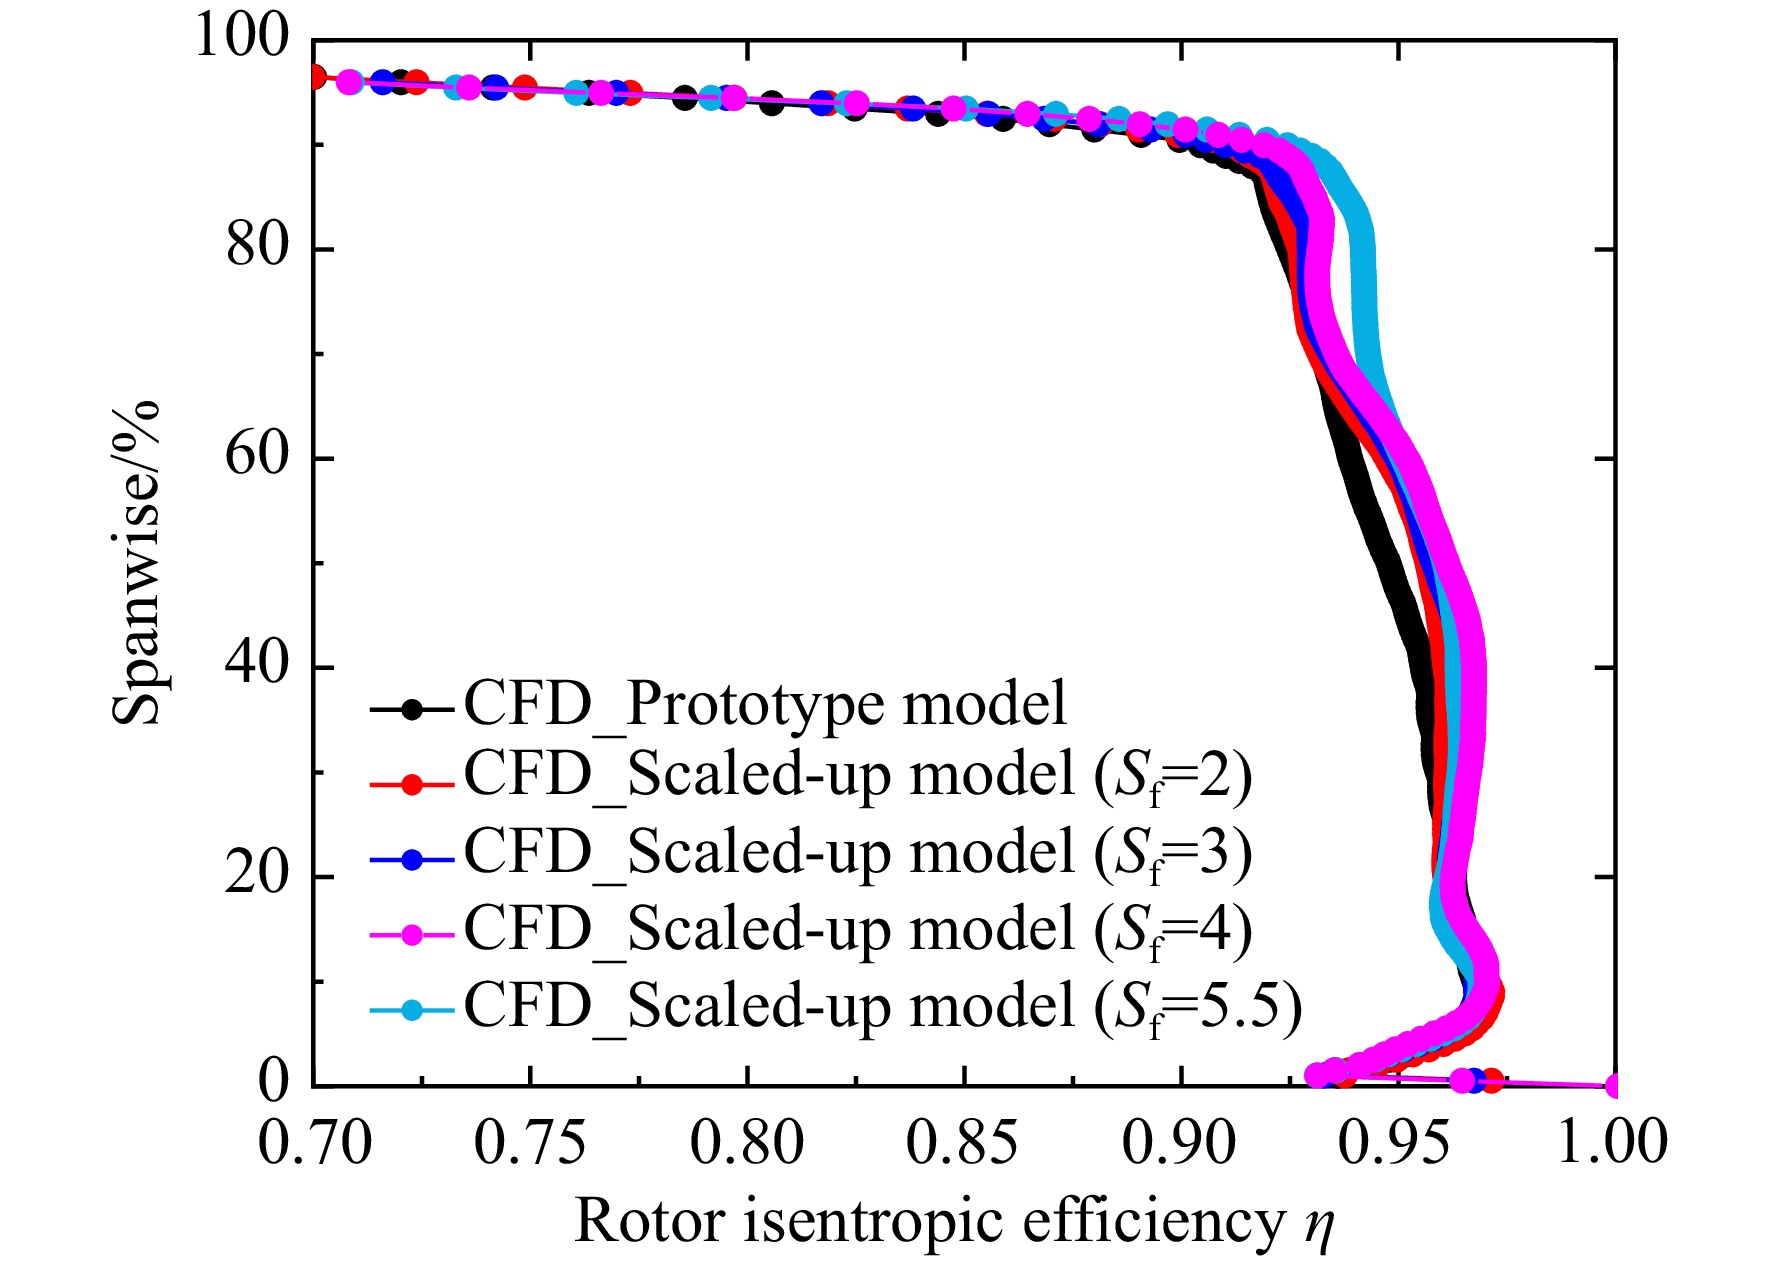
图 13 小/大模型等熵效率径向分布对比
Figure 13. Comparison of isentropic efficiency spanwise distribution between the prototype and scaled-up model
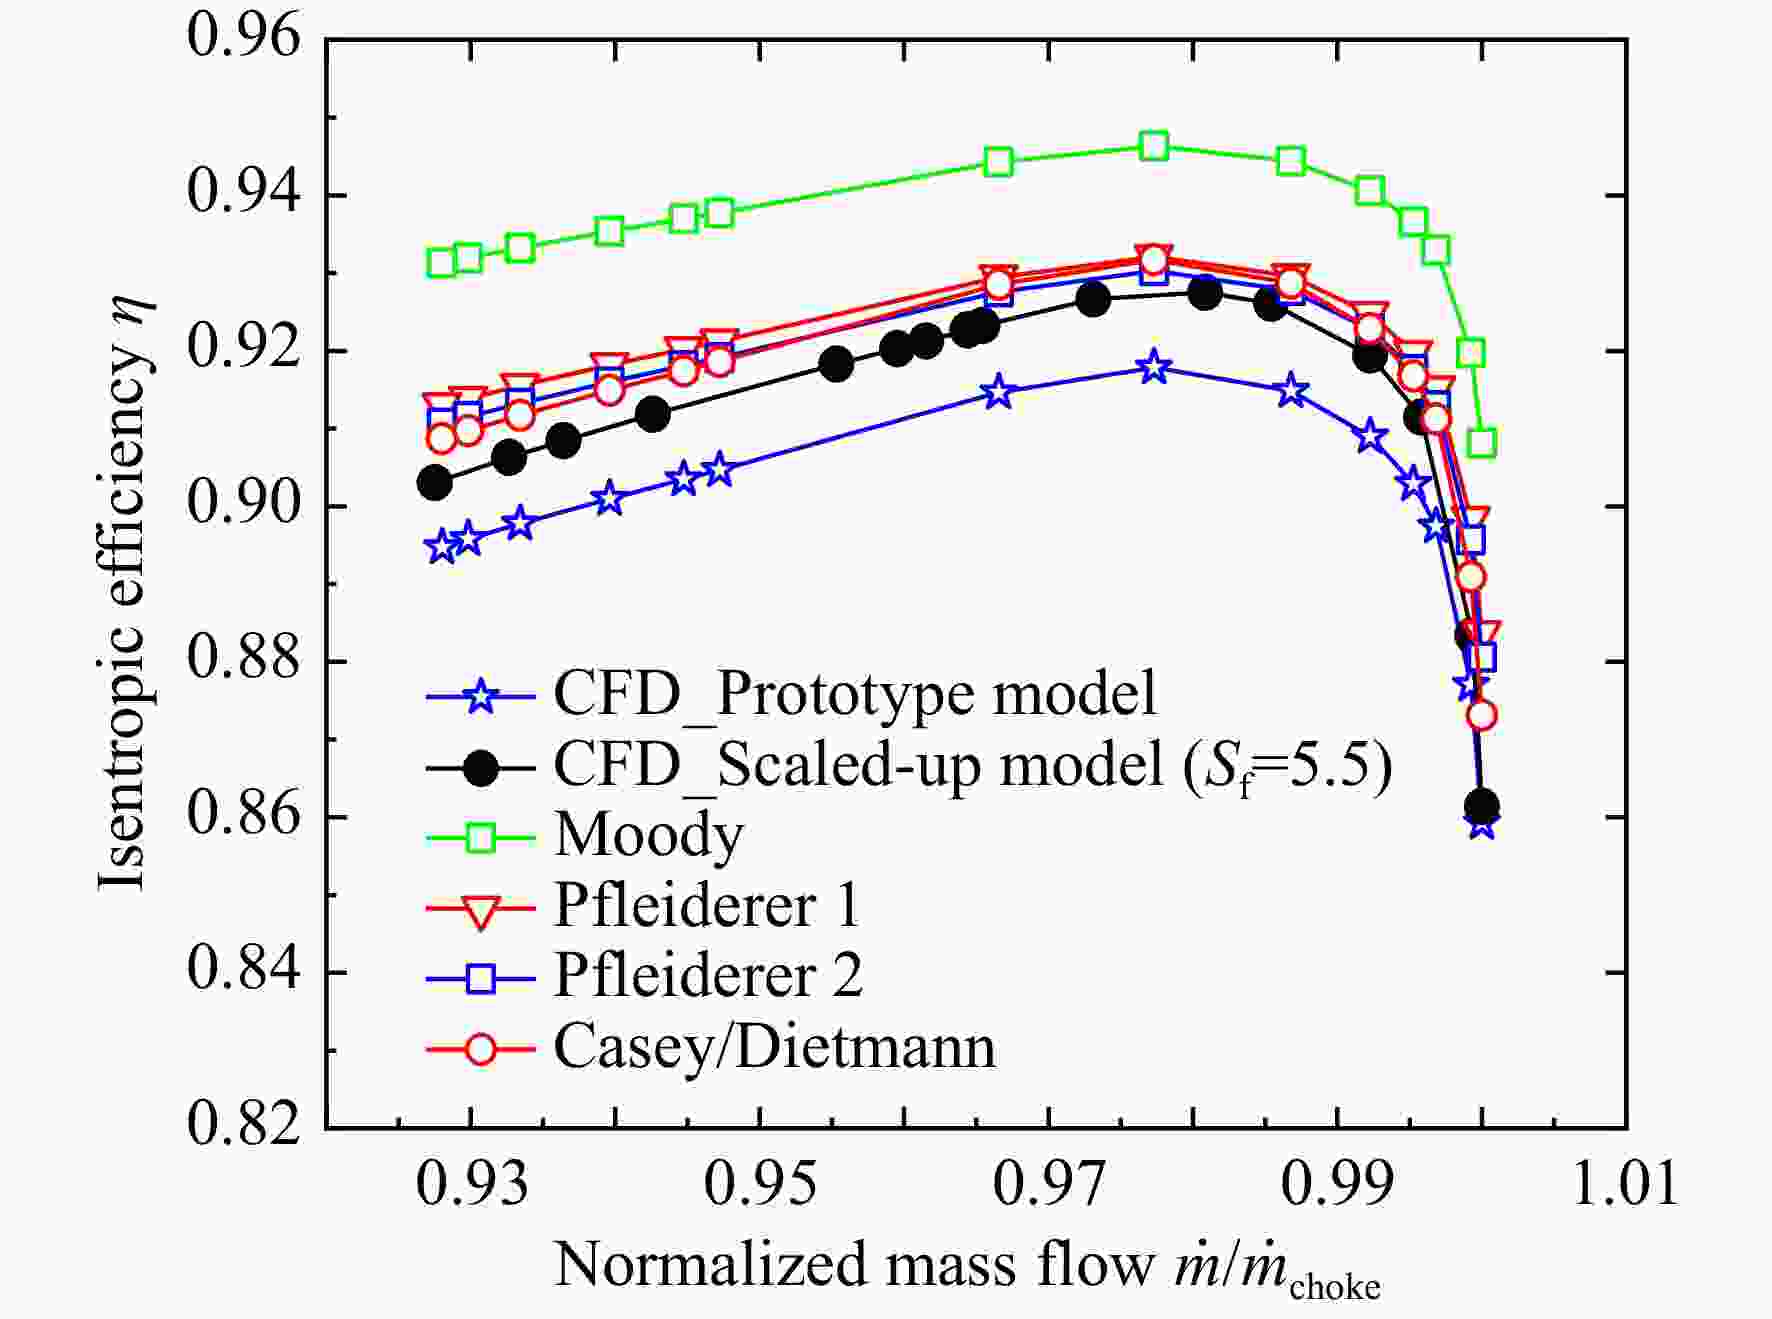
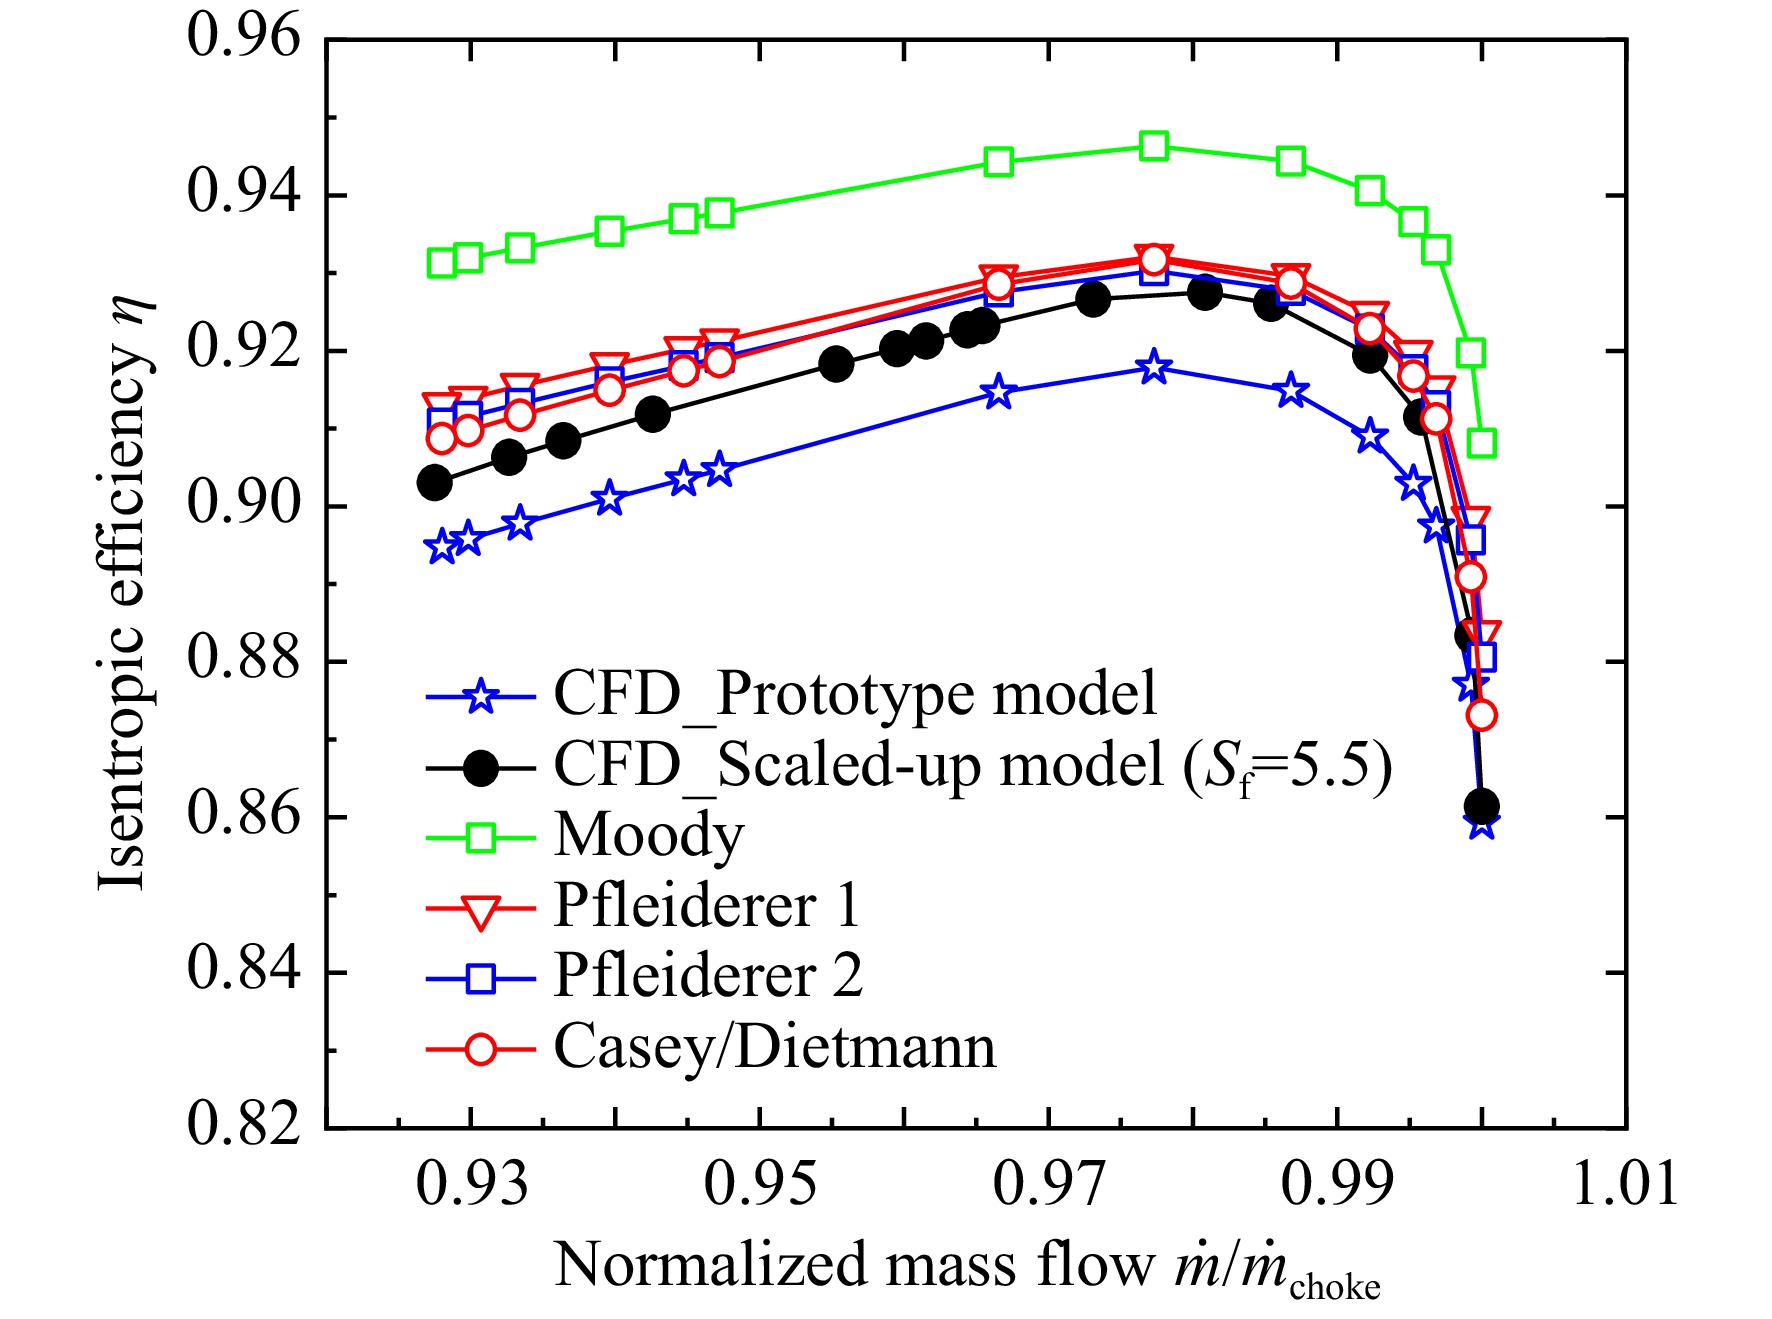
图 14 等熵效率预测模型结果对比(Case A: Sf=5.5)
Figure 14. Comparsion of isentropic efficiency of various prediction models (Case A: Sf=5.5)
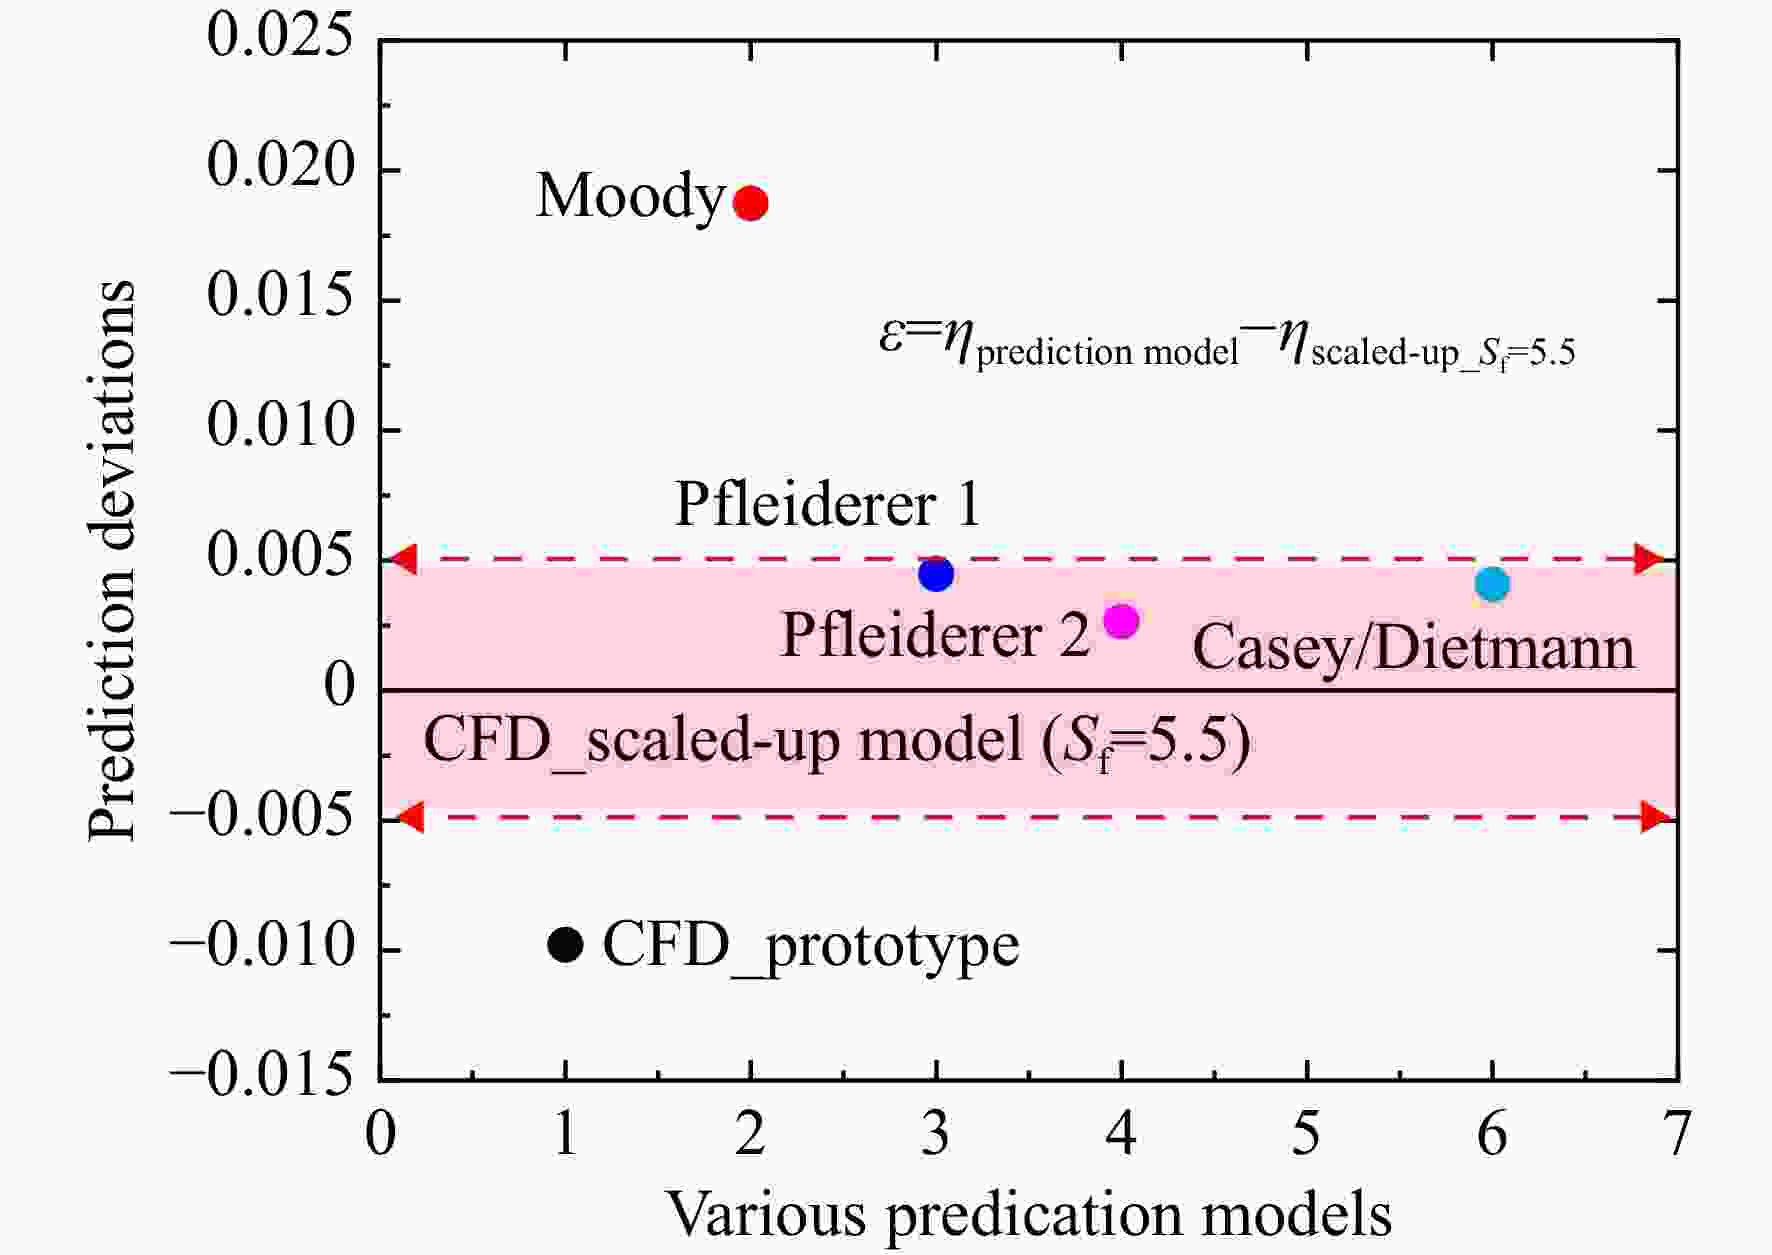
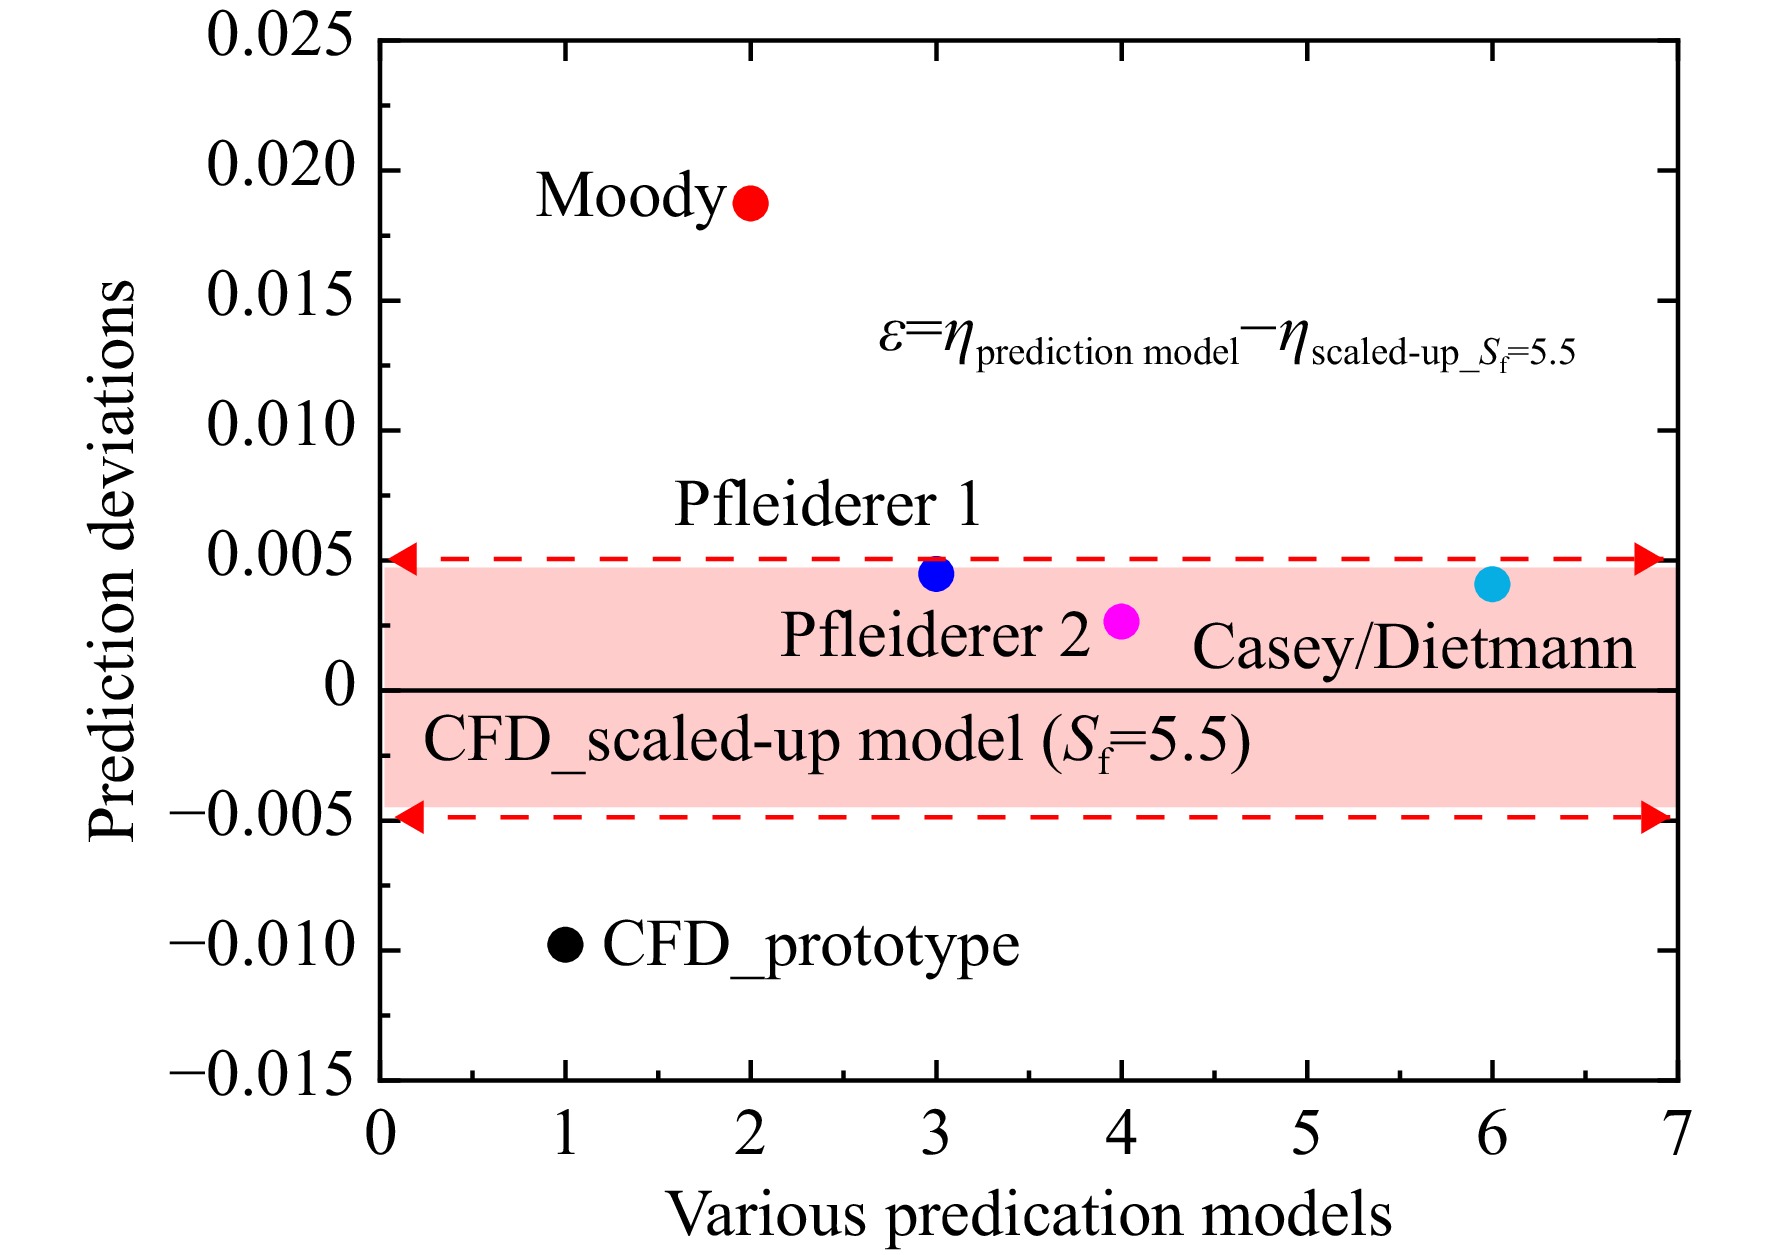
图 15 不同预测模型近最高效率点效率偏差(Case A)
Figure 15. Efficiency deviations of various predication models near PE (Case A)
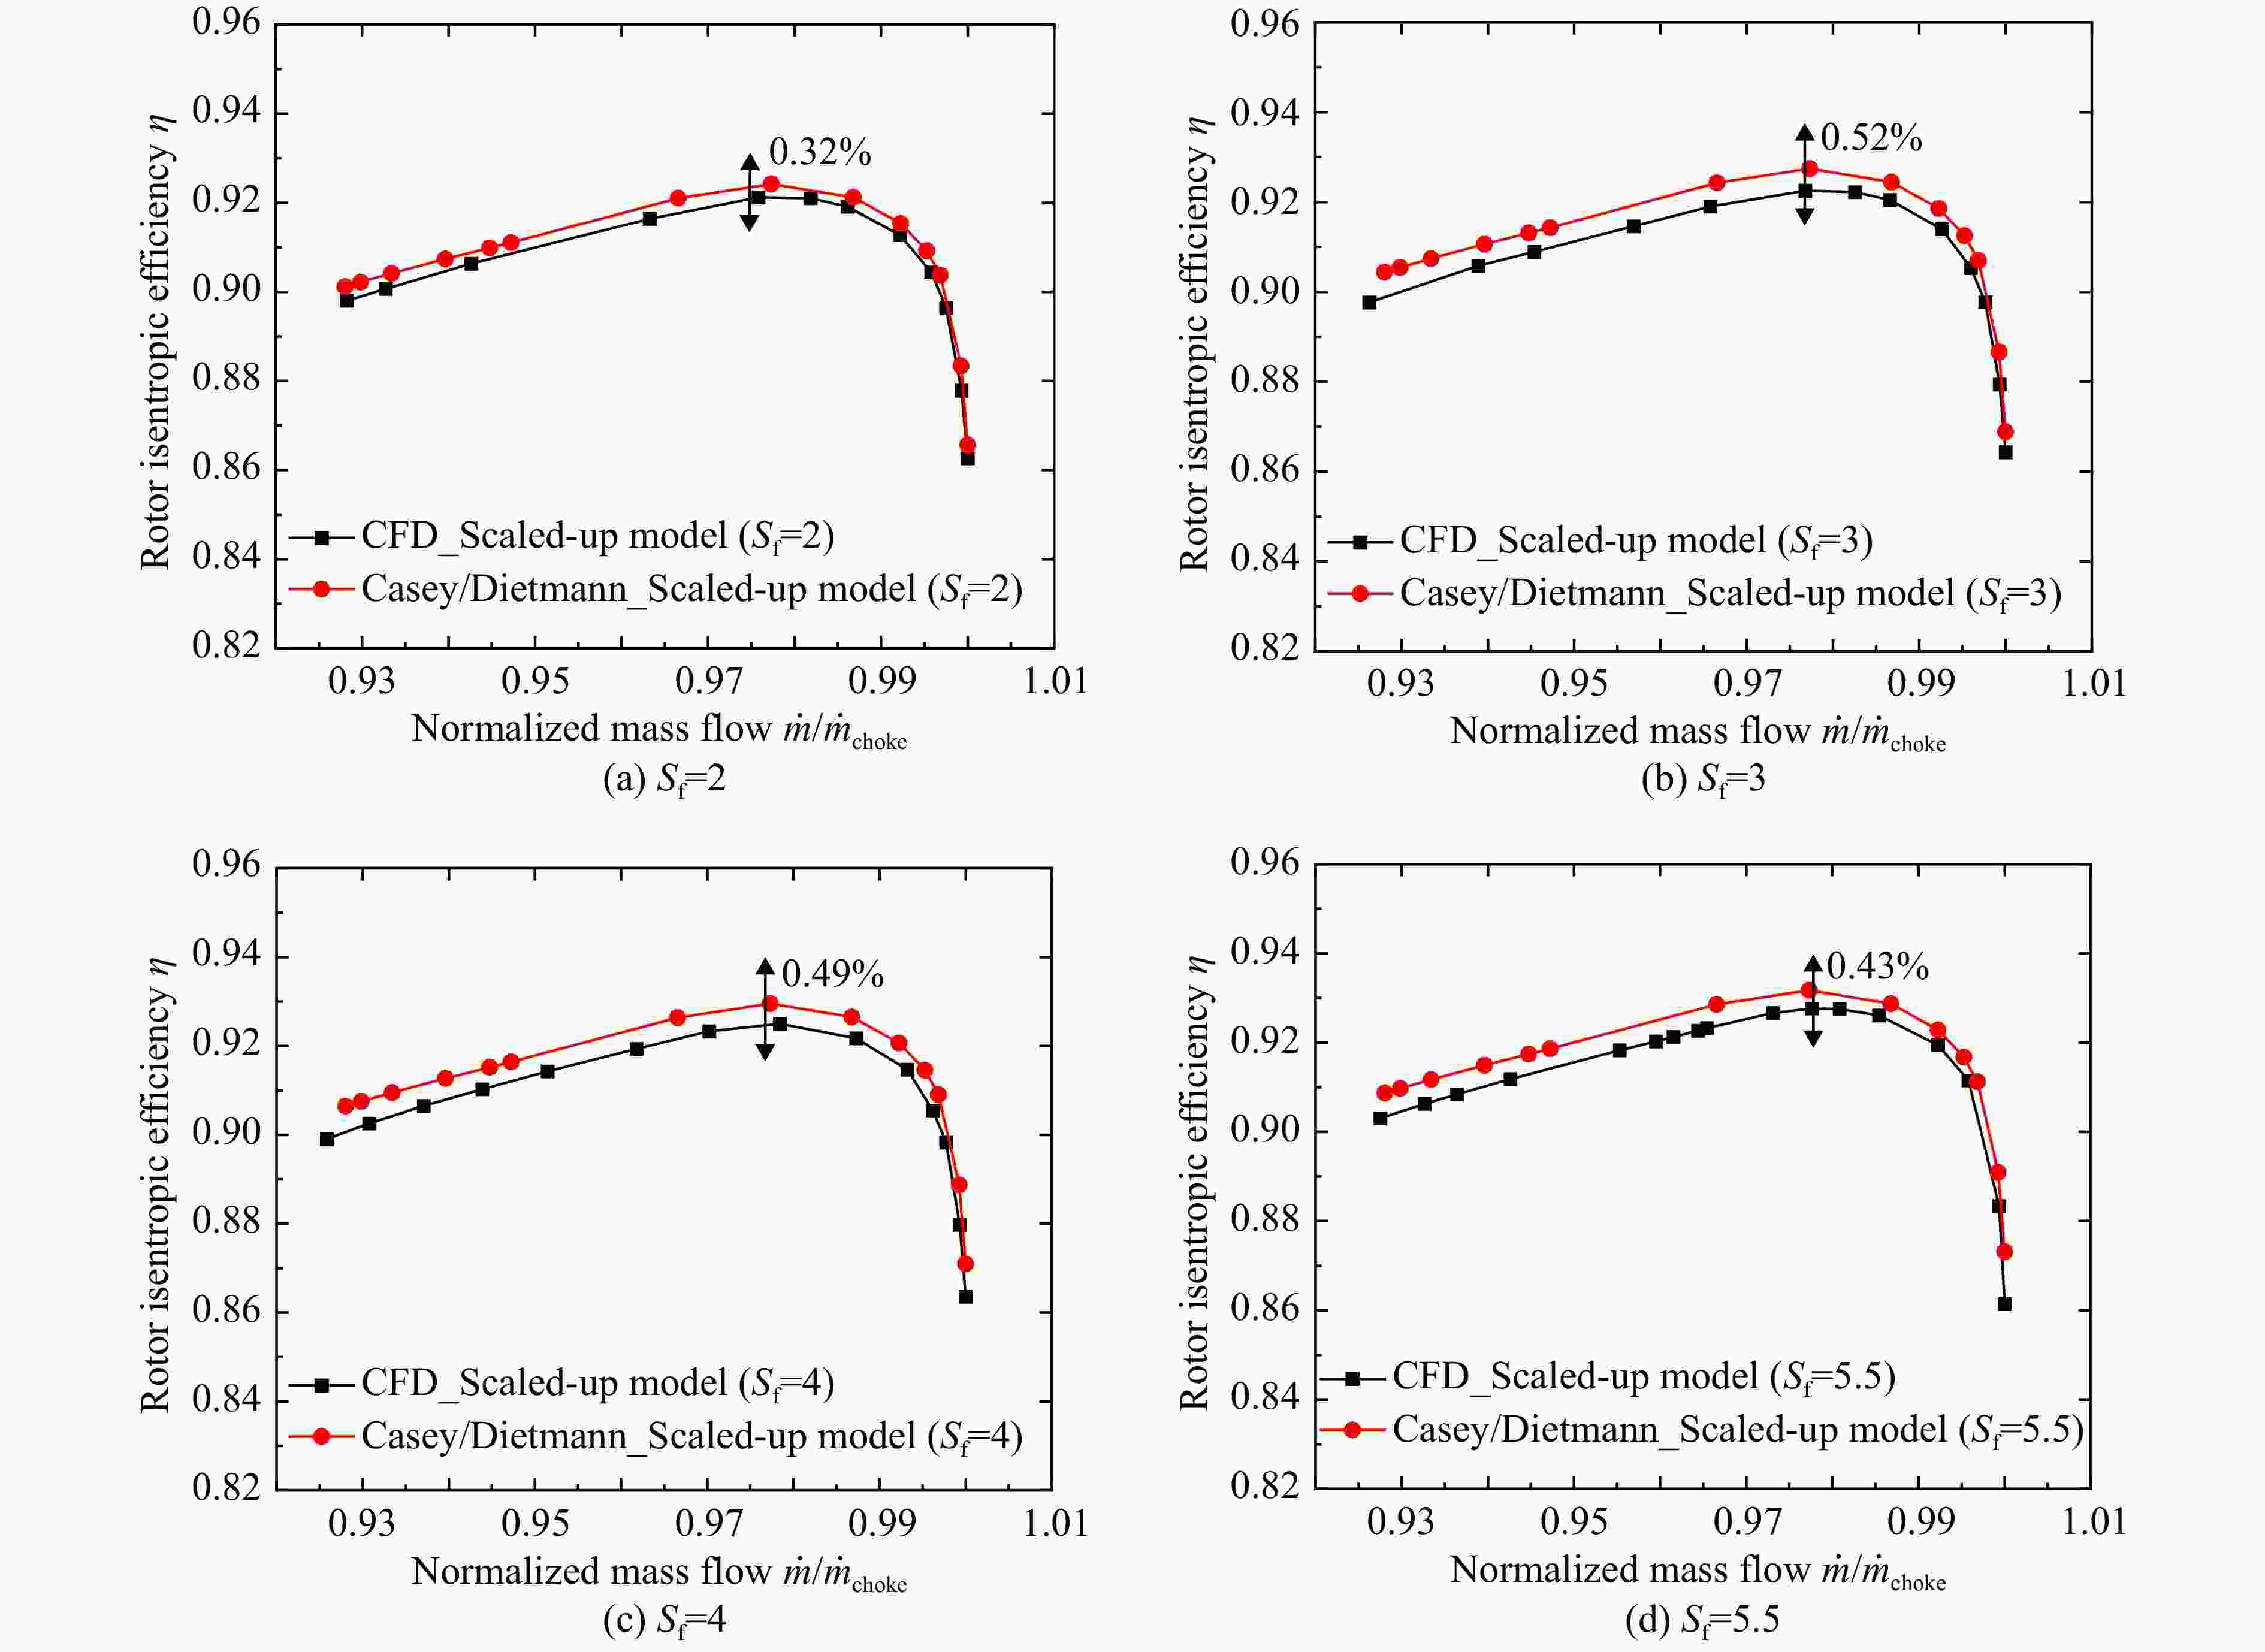
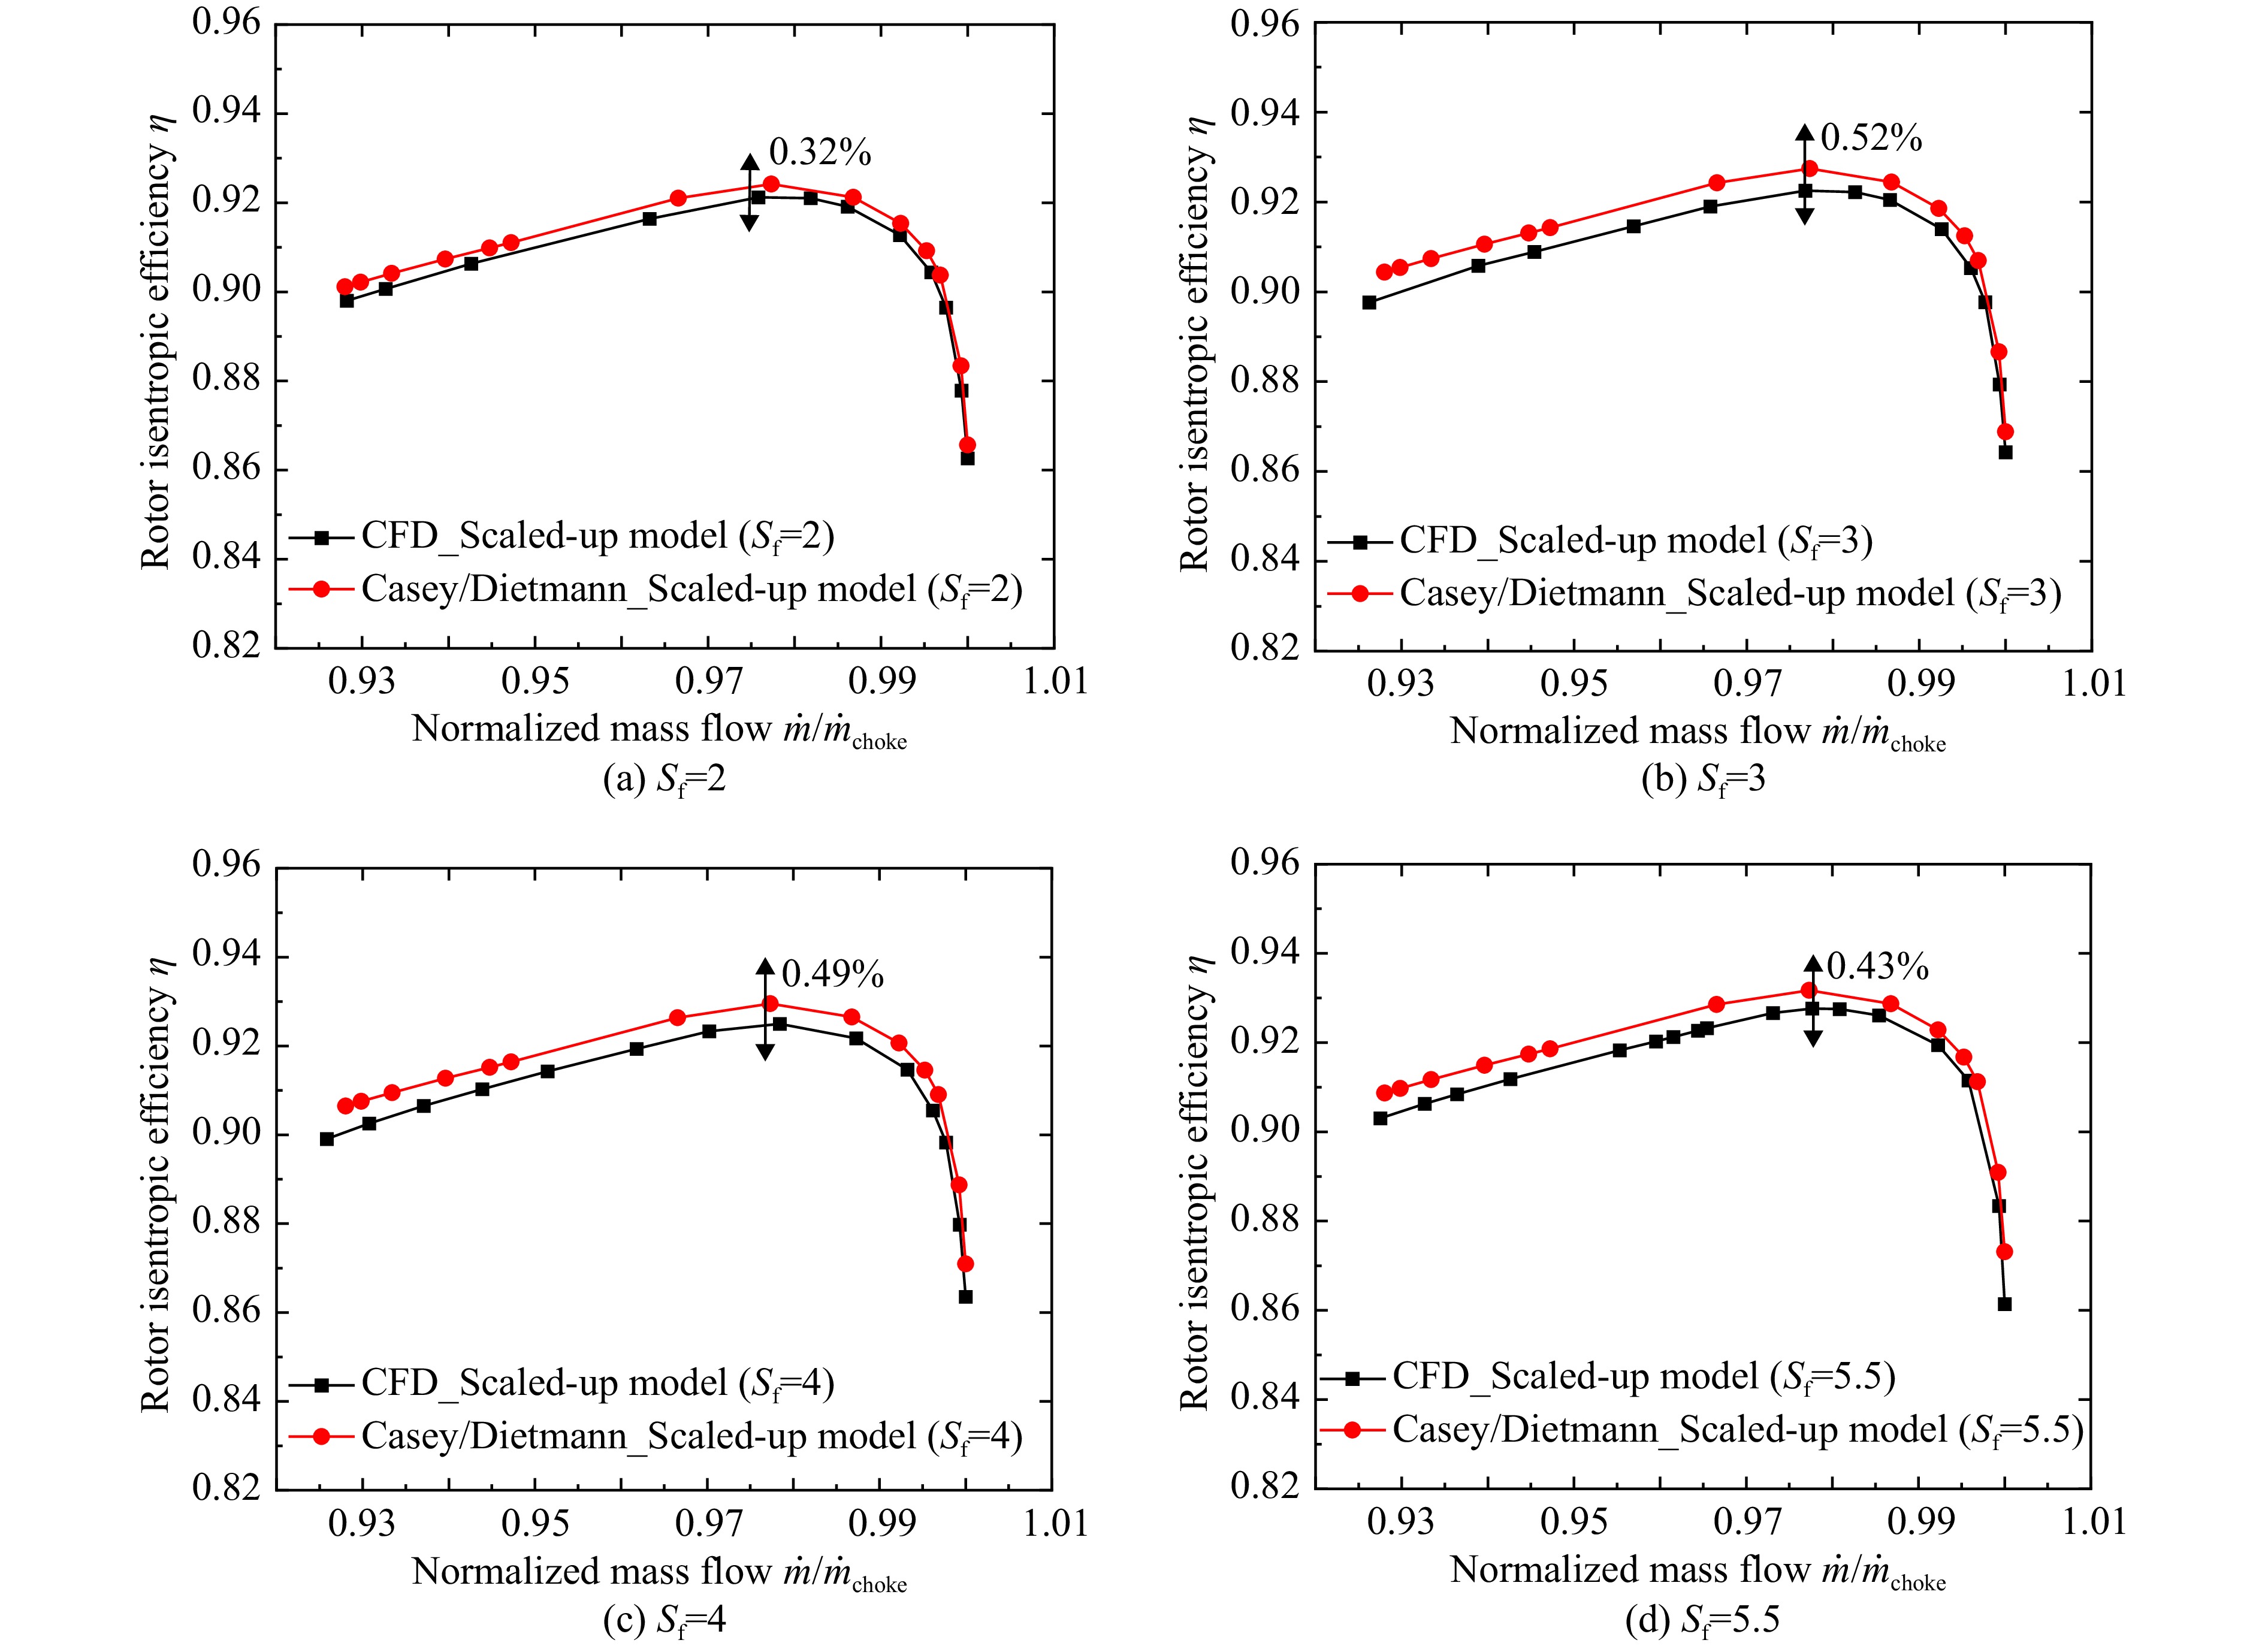
图 16 不同Sf CFD数值与Casey模型结果对比(Case A)
Figure 16. Comparison of CFD simulation results with Casey predication models to account for various Sf (Case A)
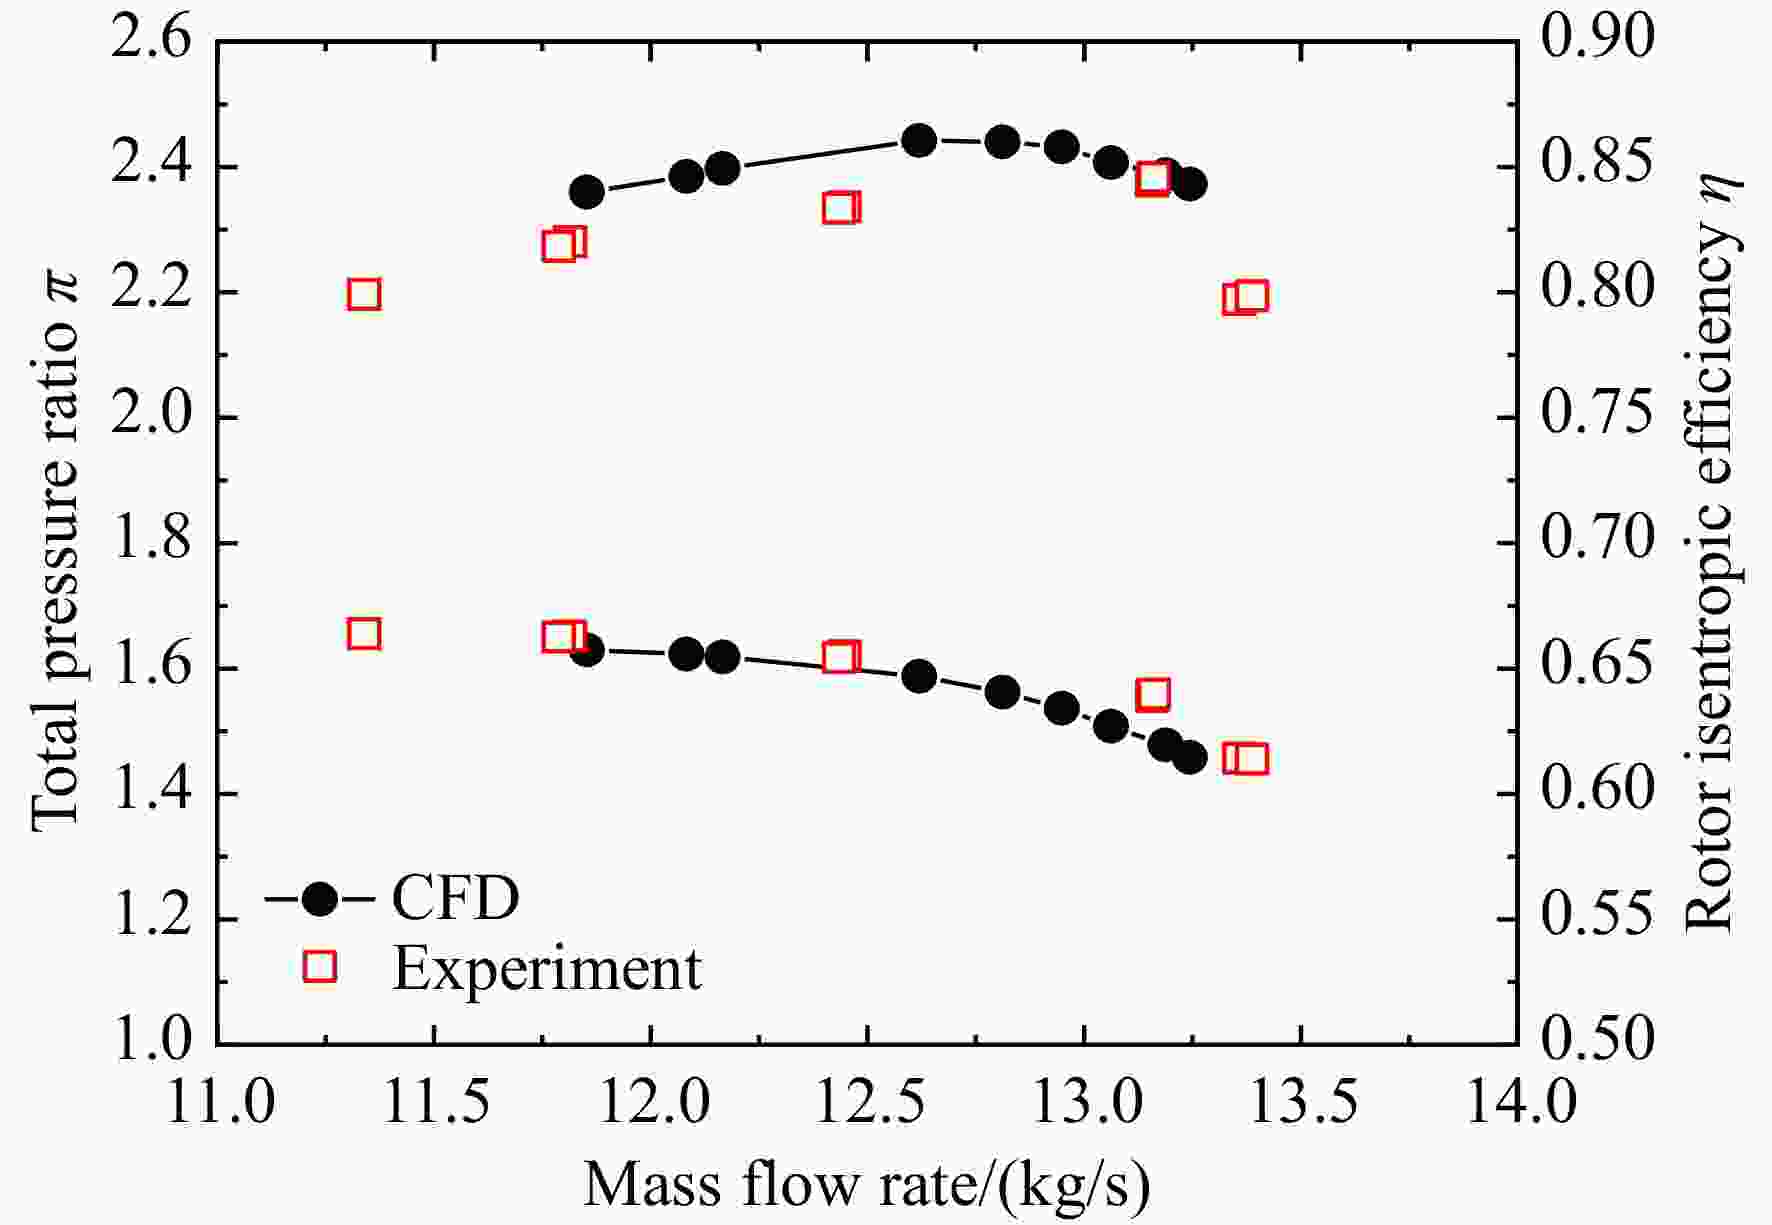
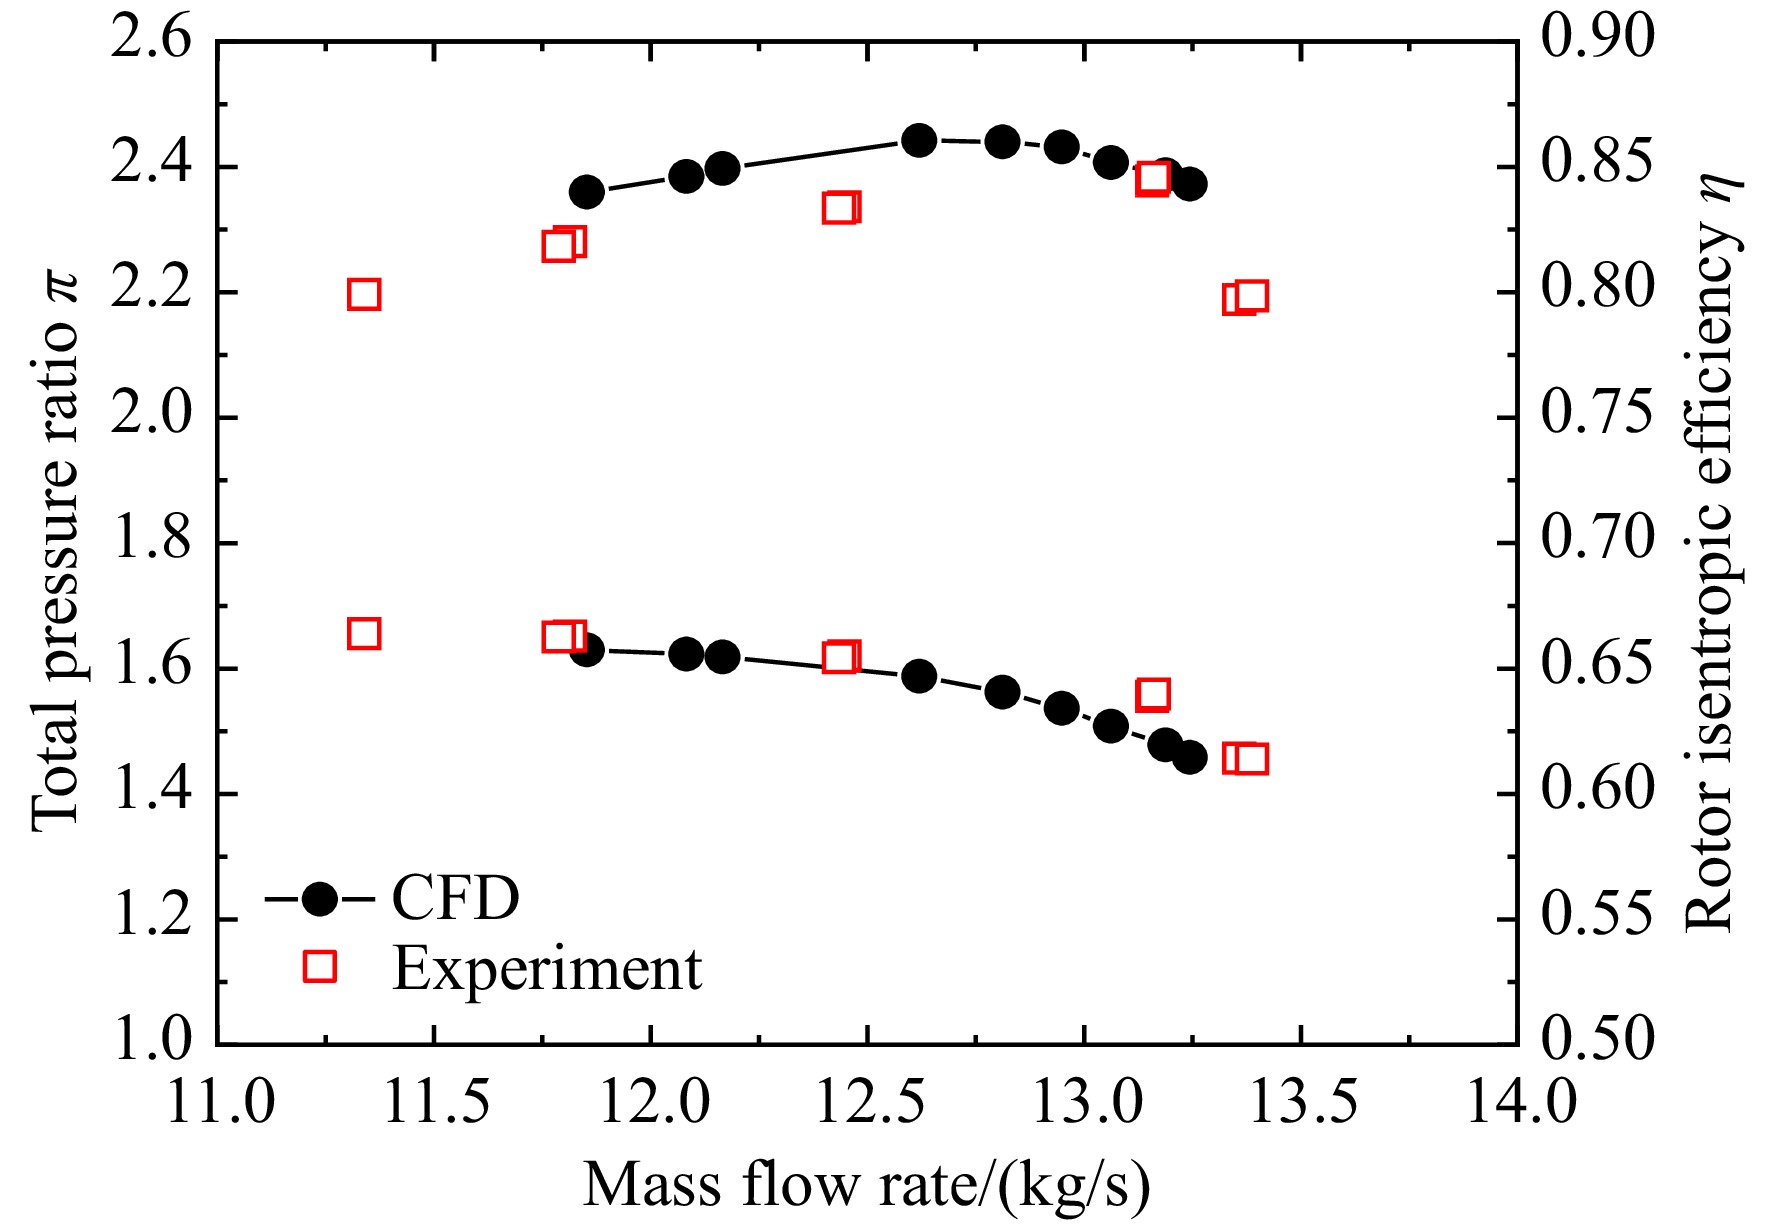
图 17 小模型流量-总压比/等熵效率(Case B)
Figure 17. Comparison of mass flow-total pressure ratio/isentropic efficiency performance curves of the prototype model (Case B)
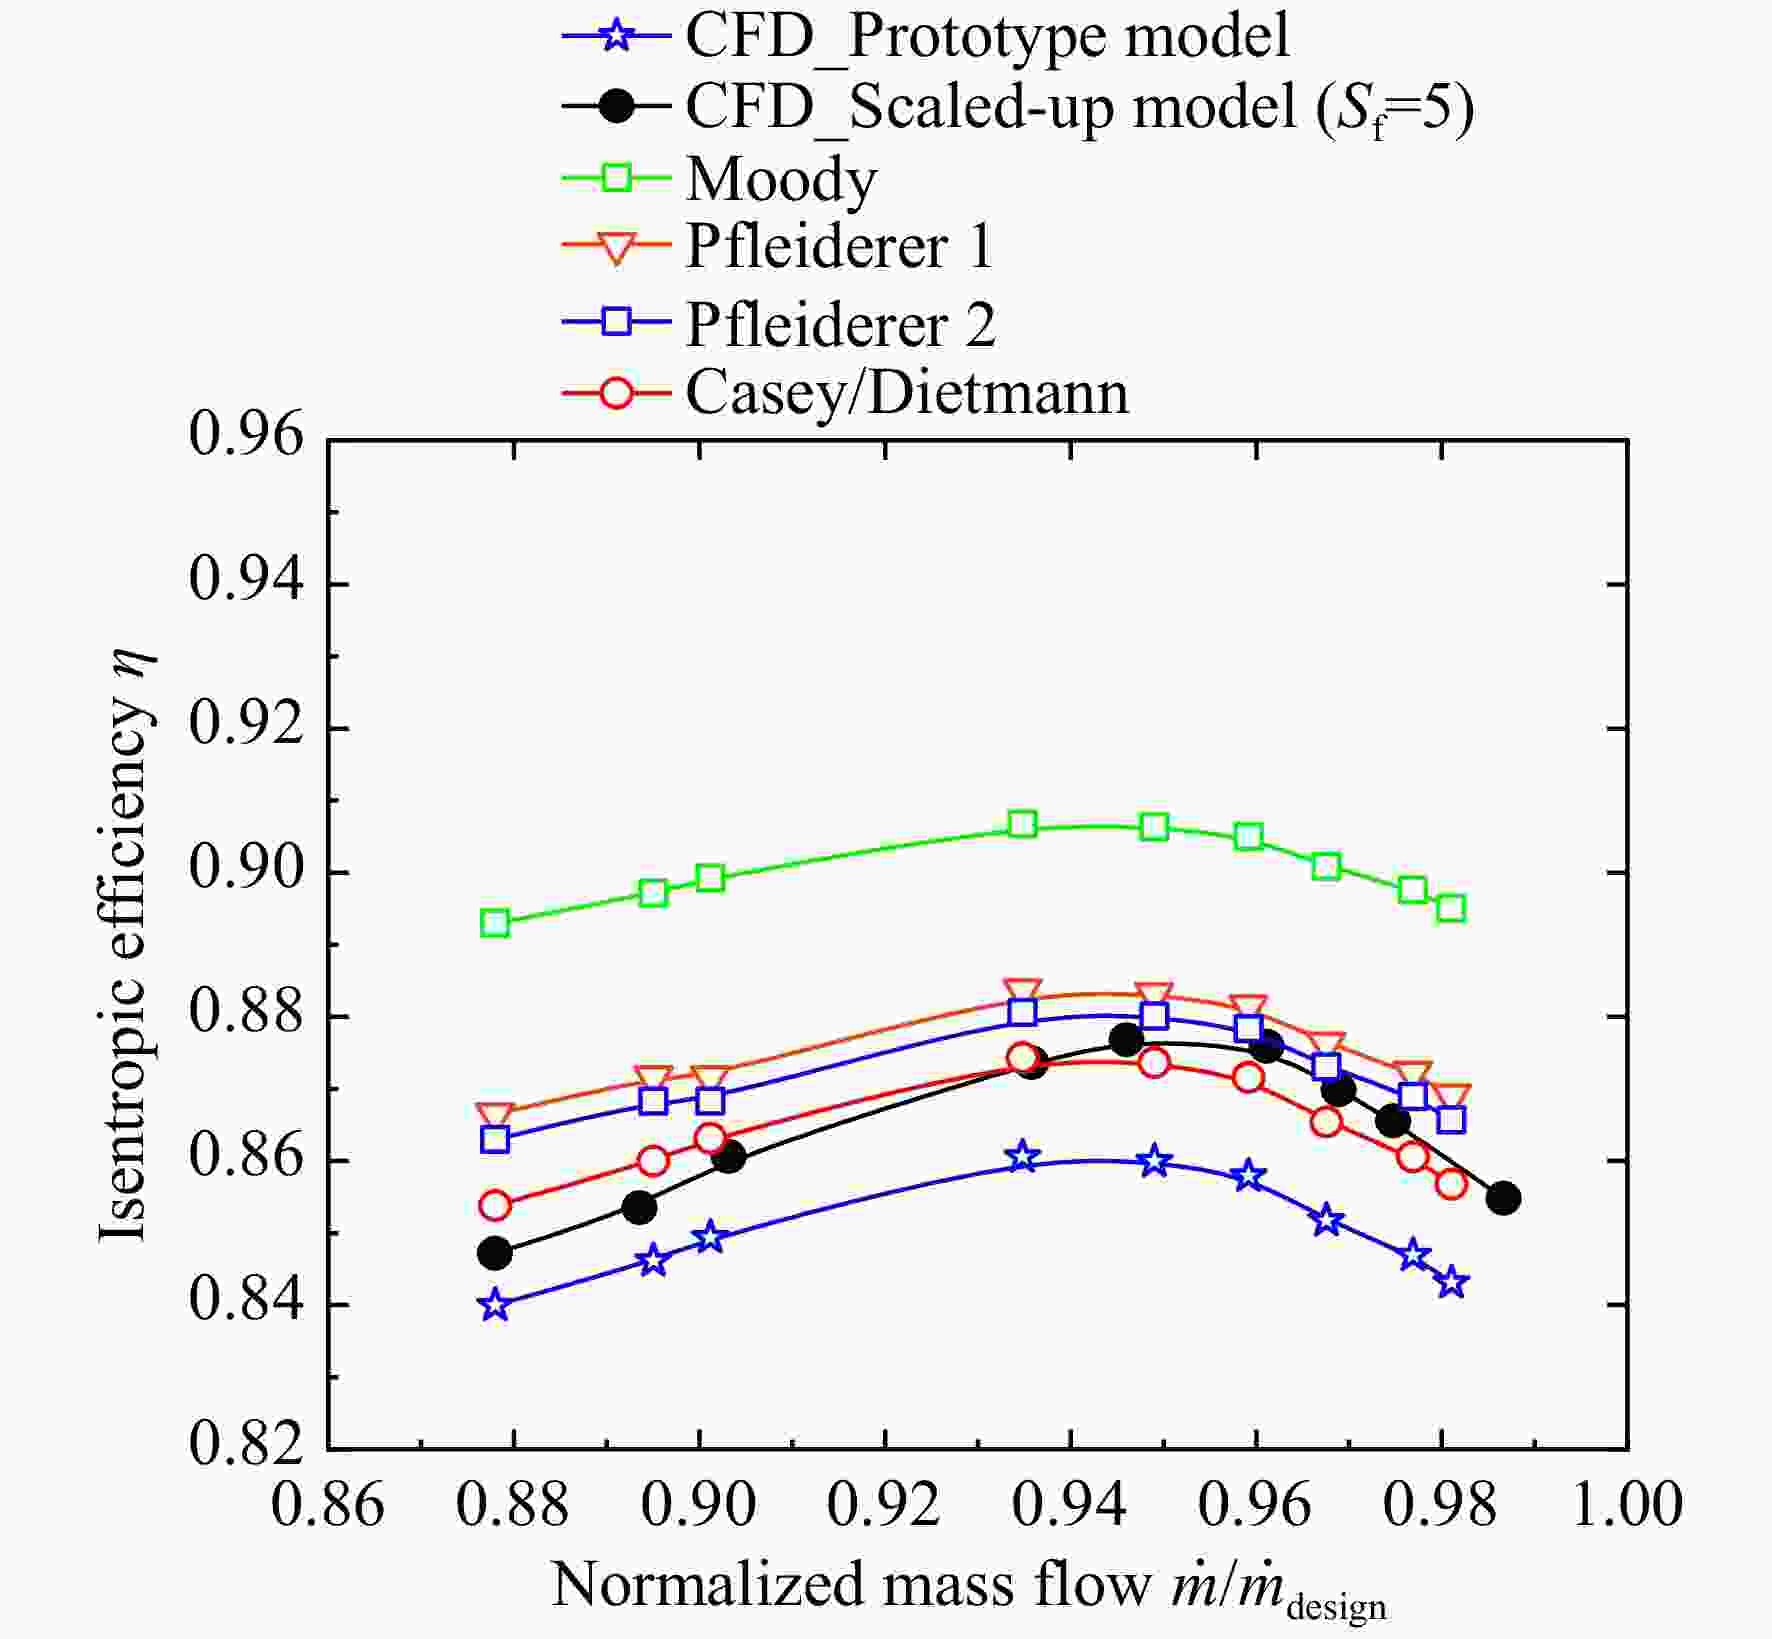
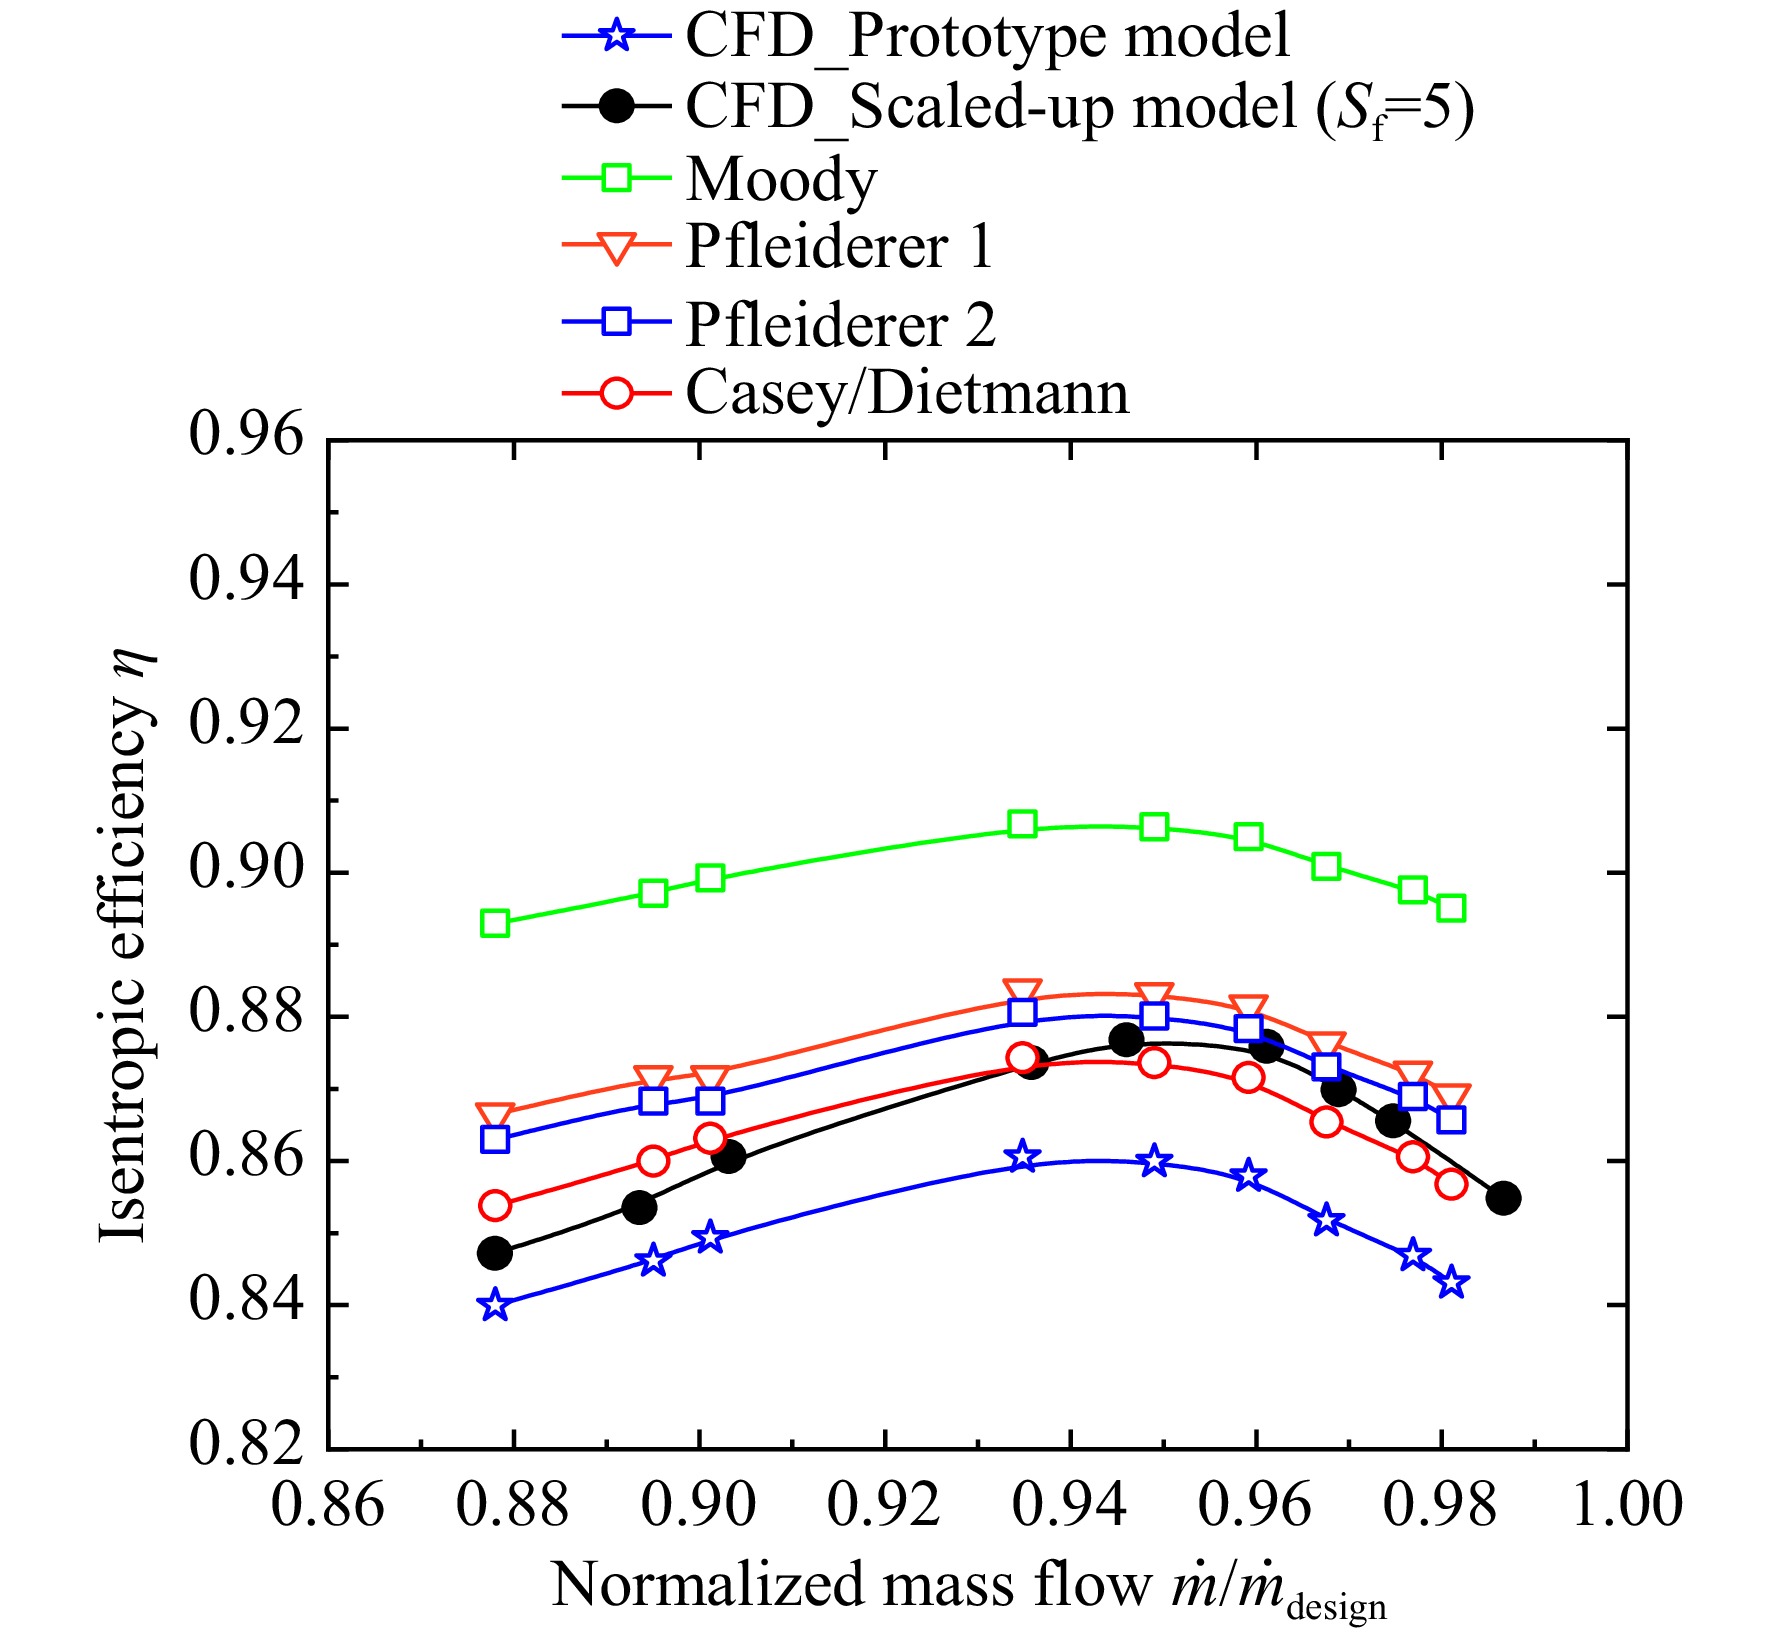
图 18 等熵效率预测模型结果对比(Case B: Sf = 5)
Figure 18. Comparison of isentropic efficiency of prediction models (Case B: Sf = 5)
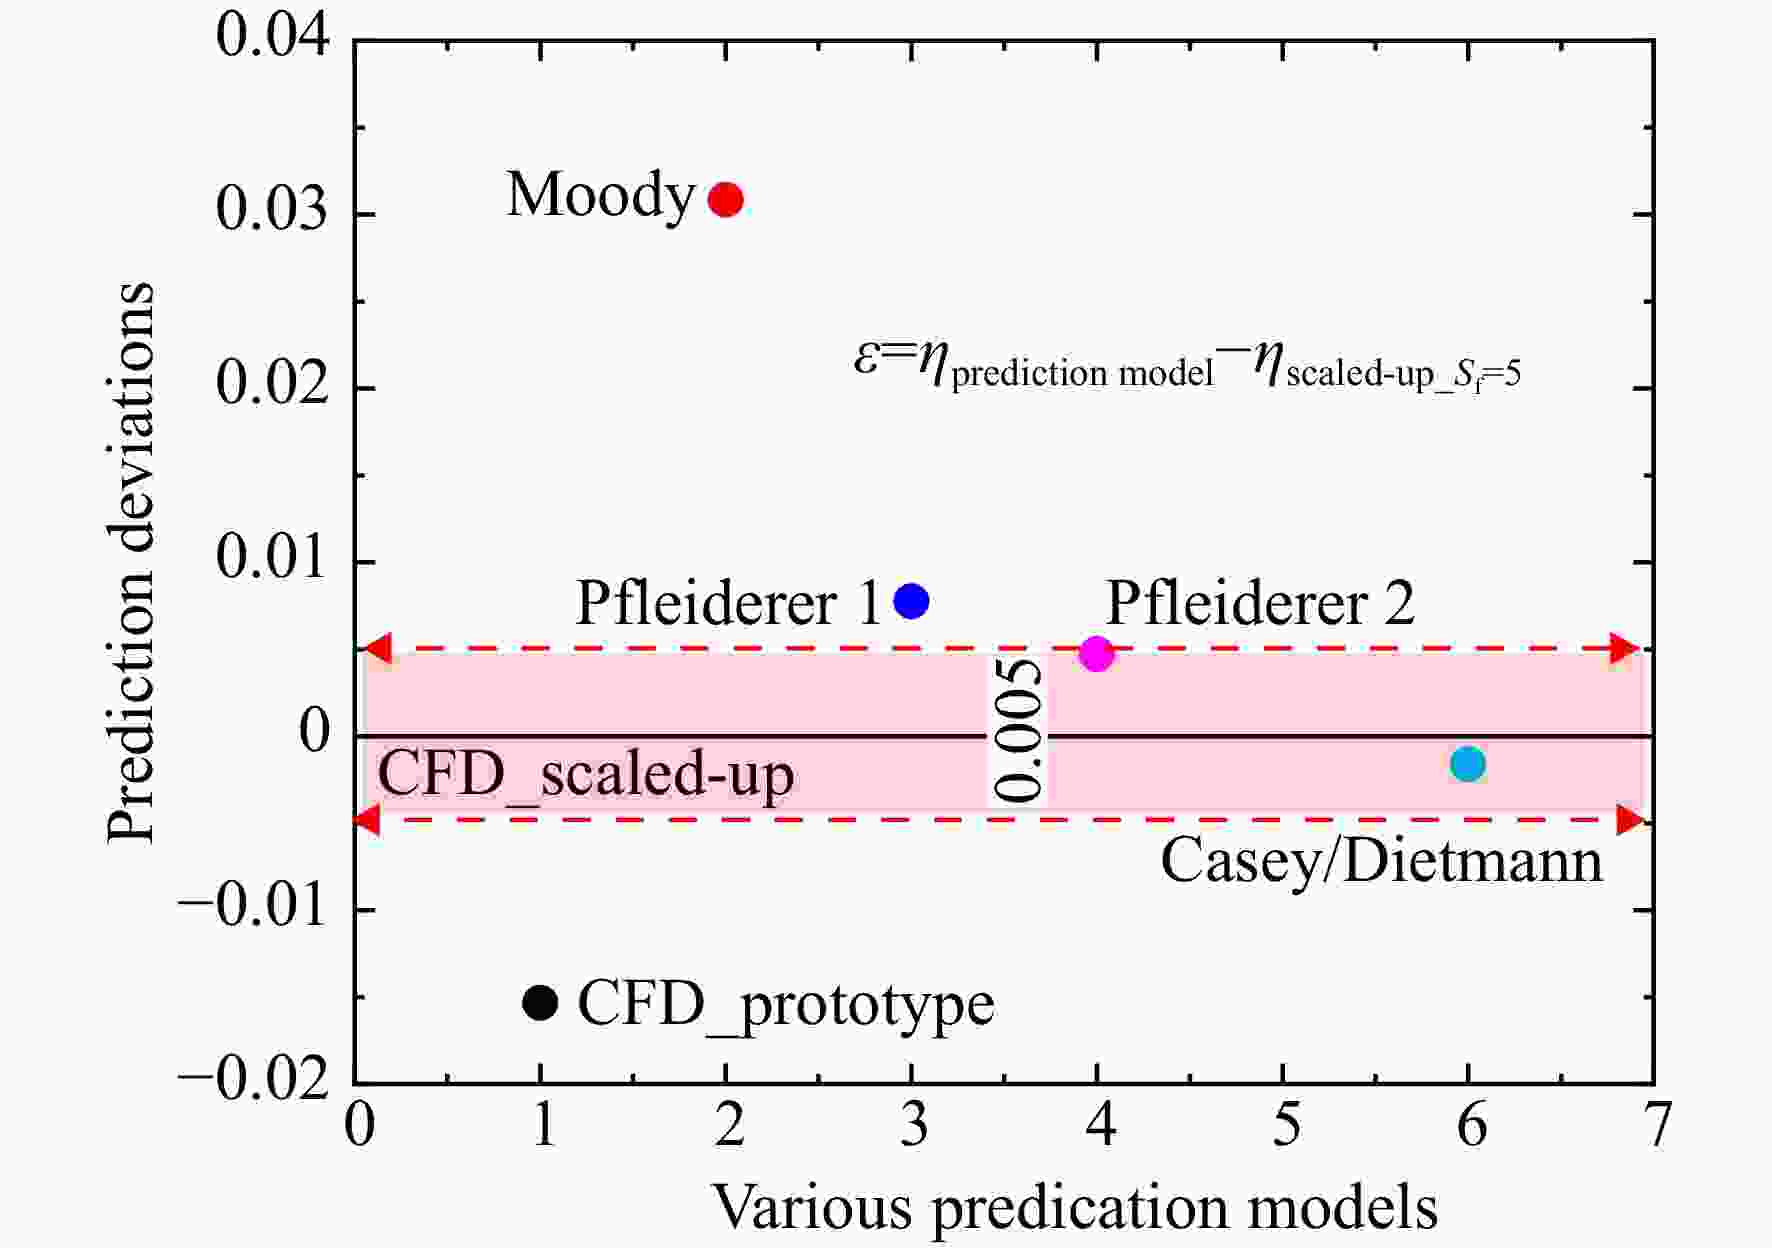
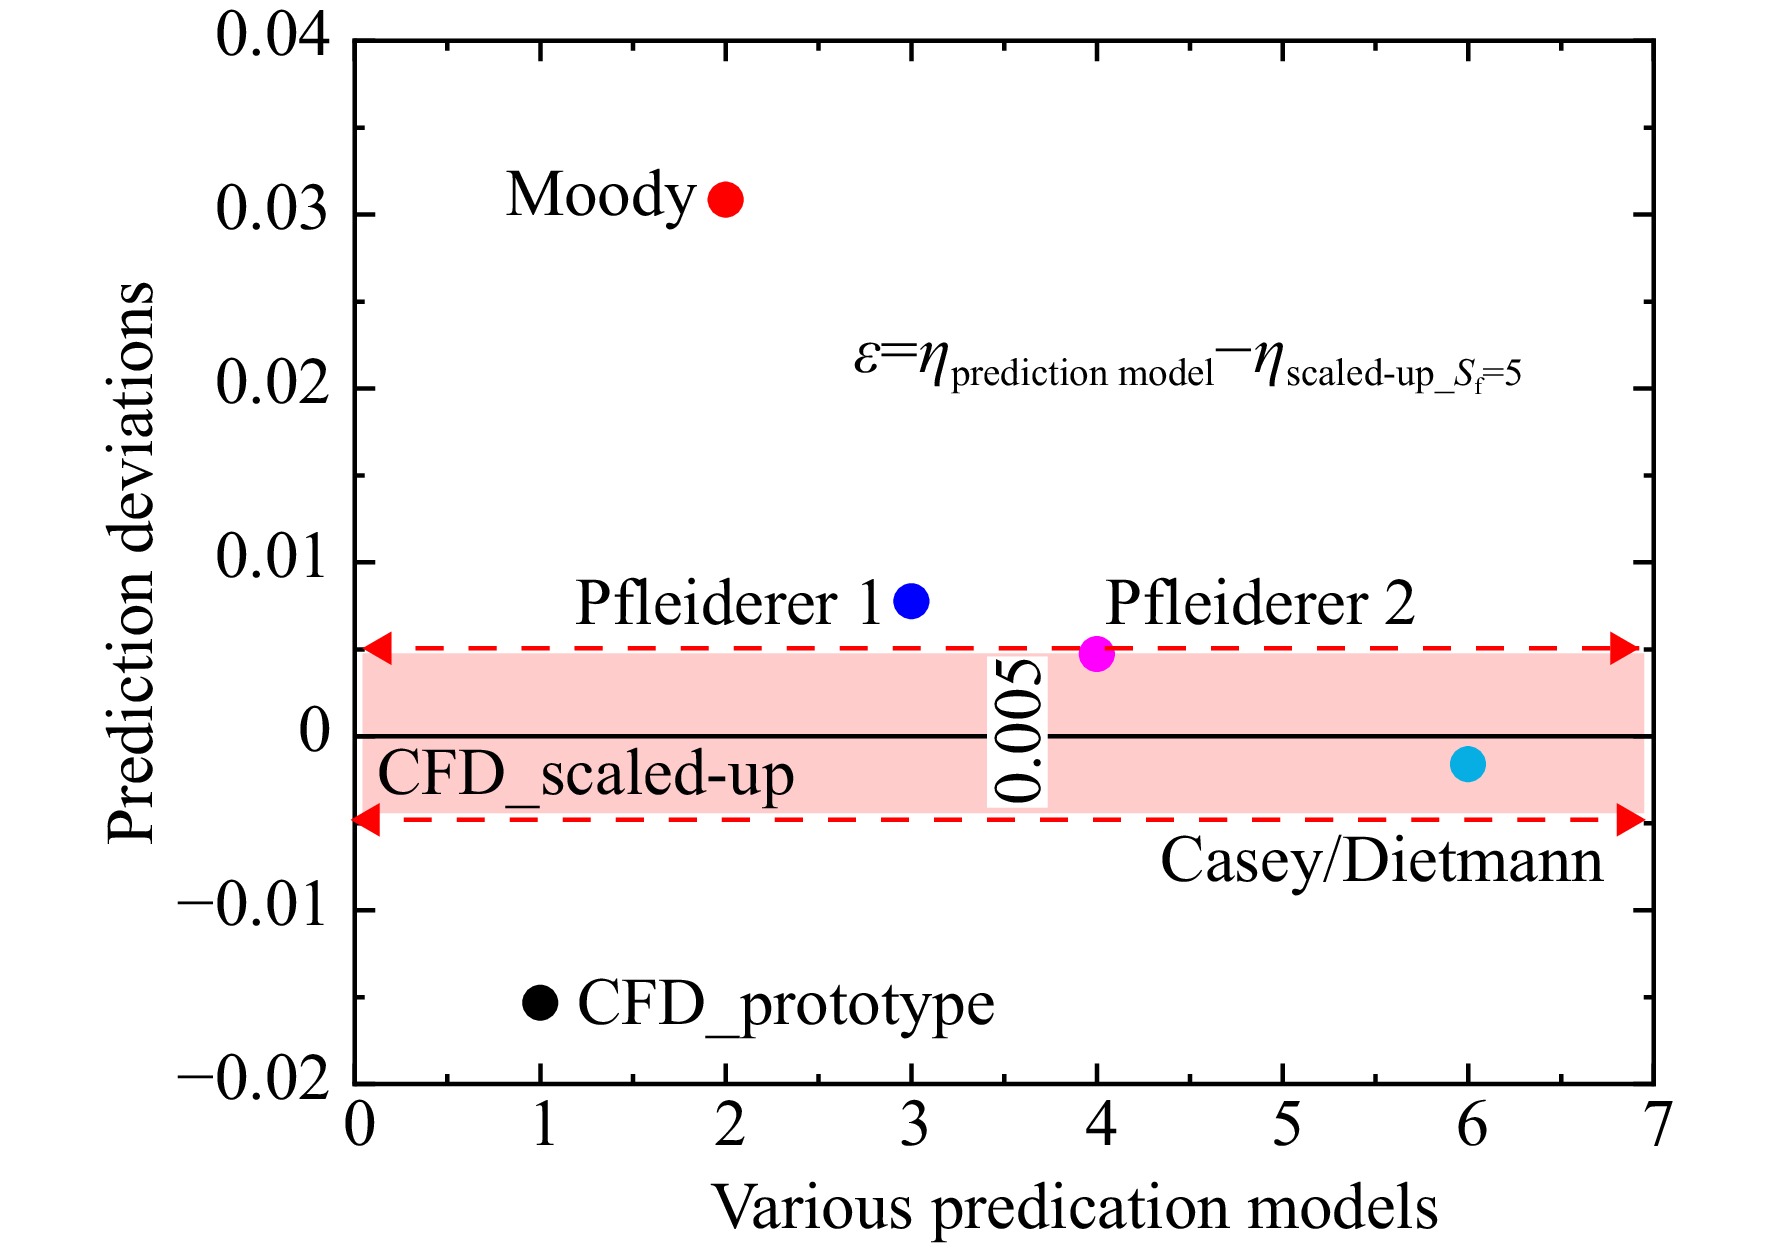
图 19 不同预测模型近最高效率点效率偏差(Case B)
Figure 19. Efficiency deviations of various predication models near PE (Case B)
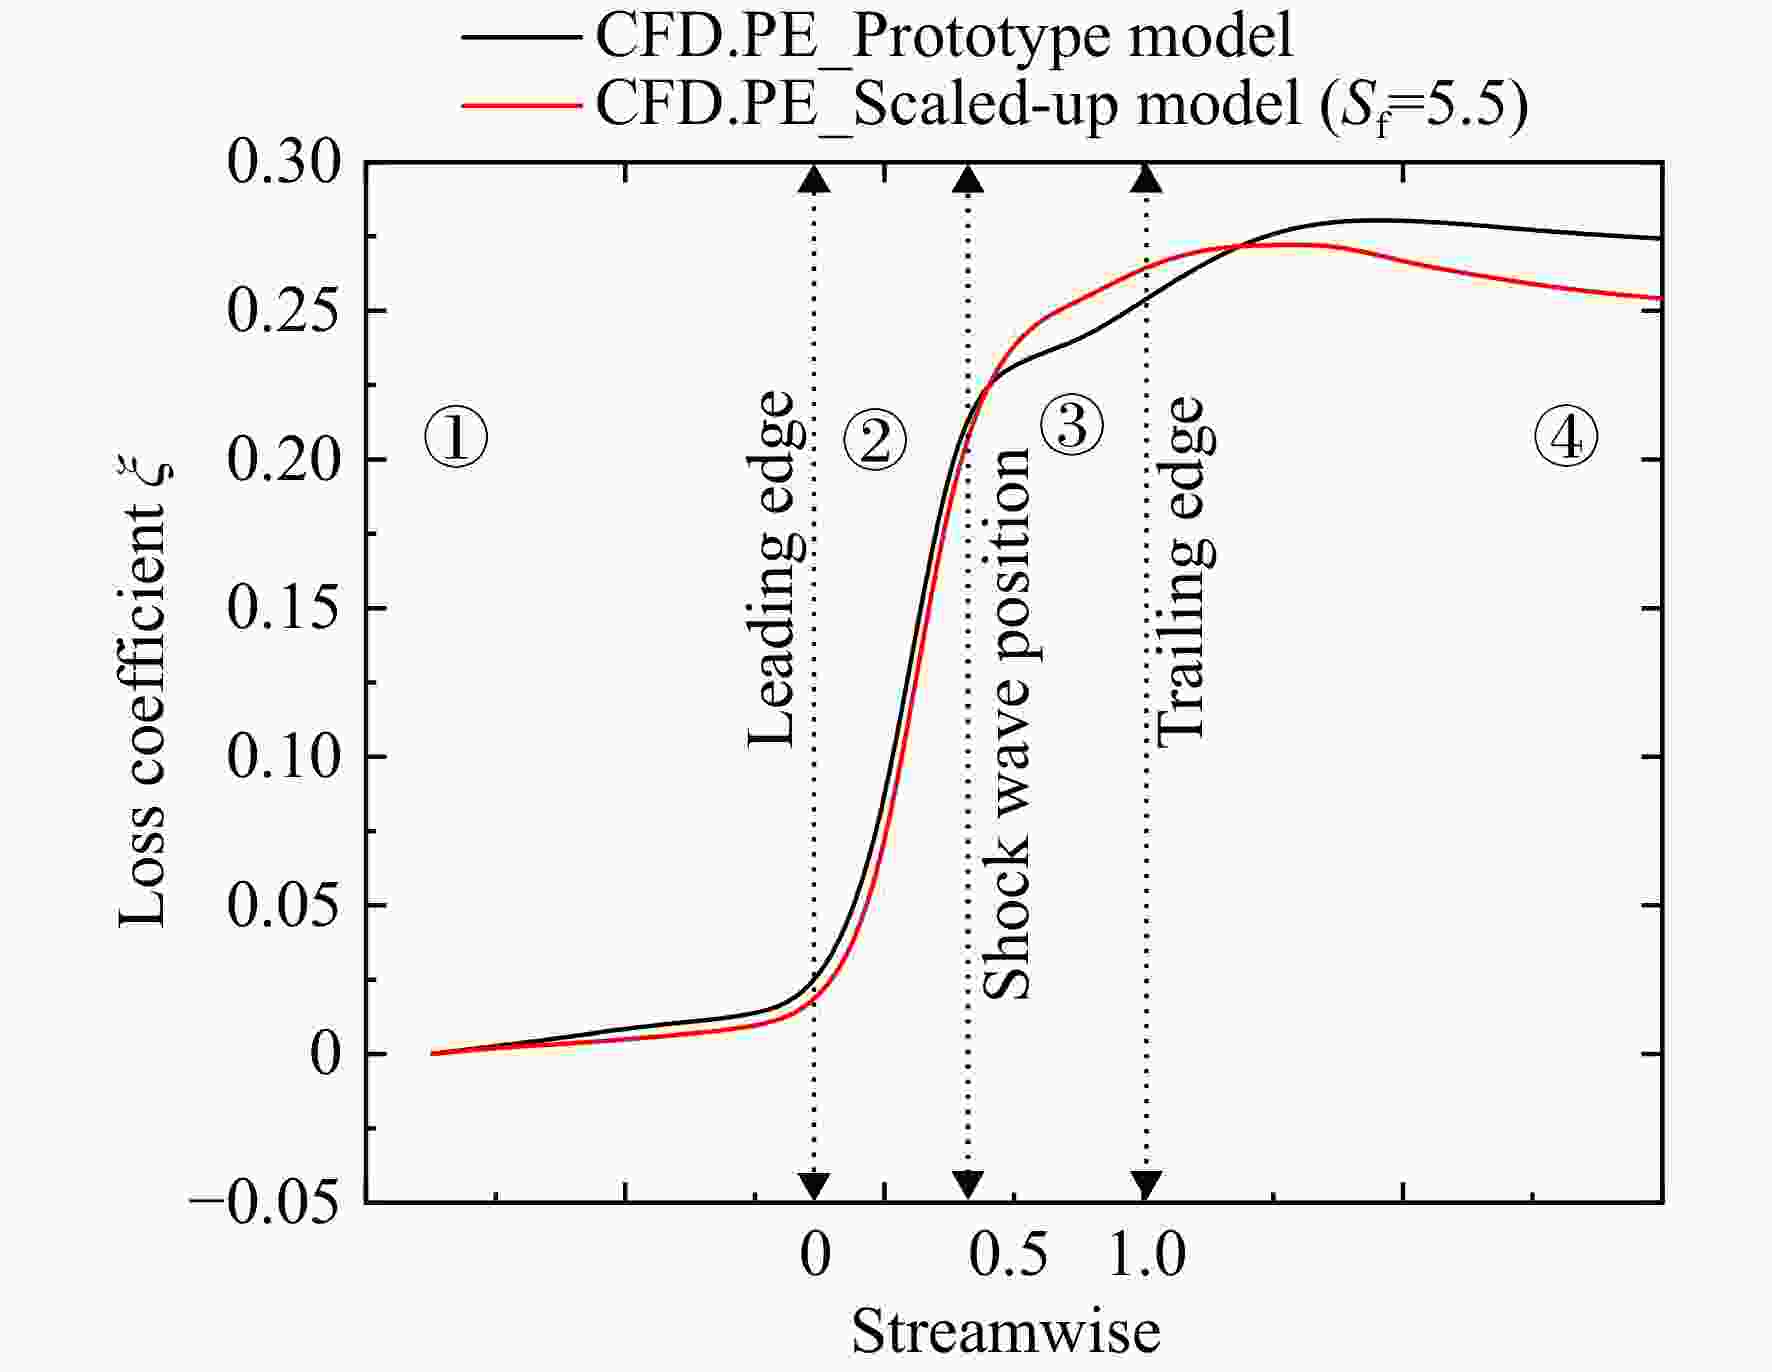
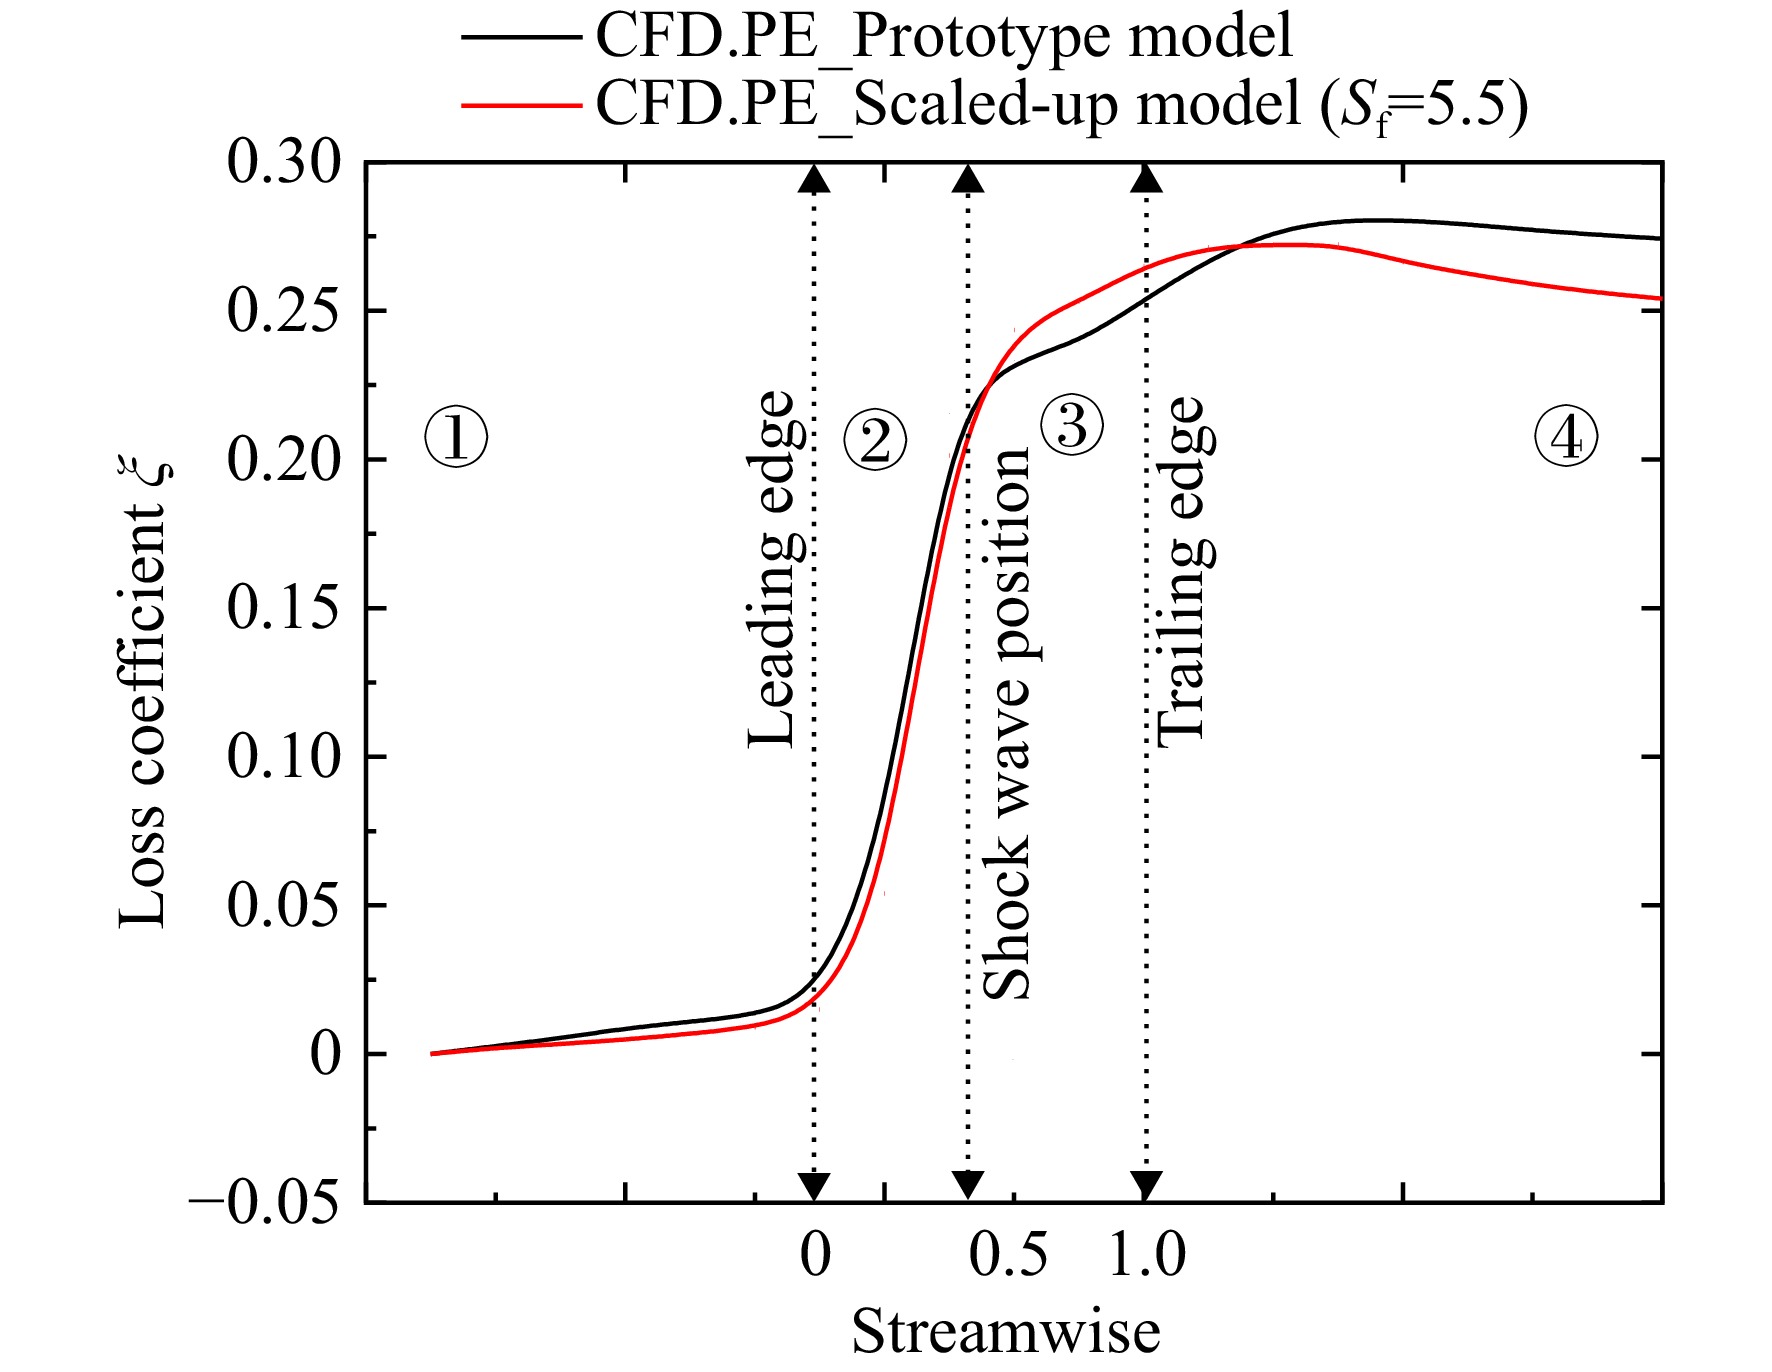
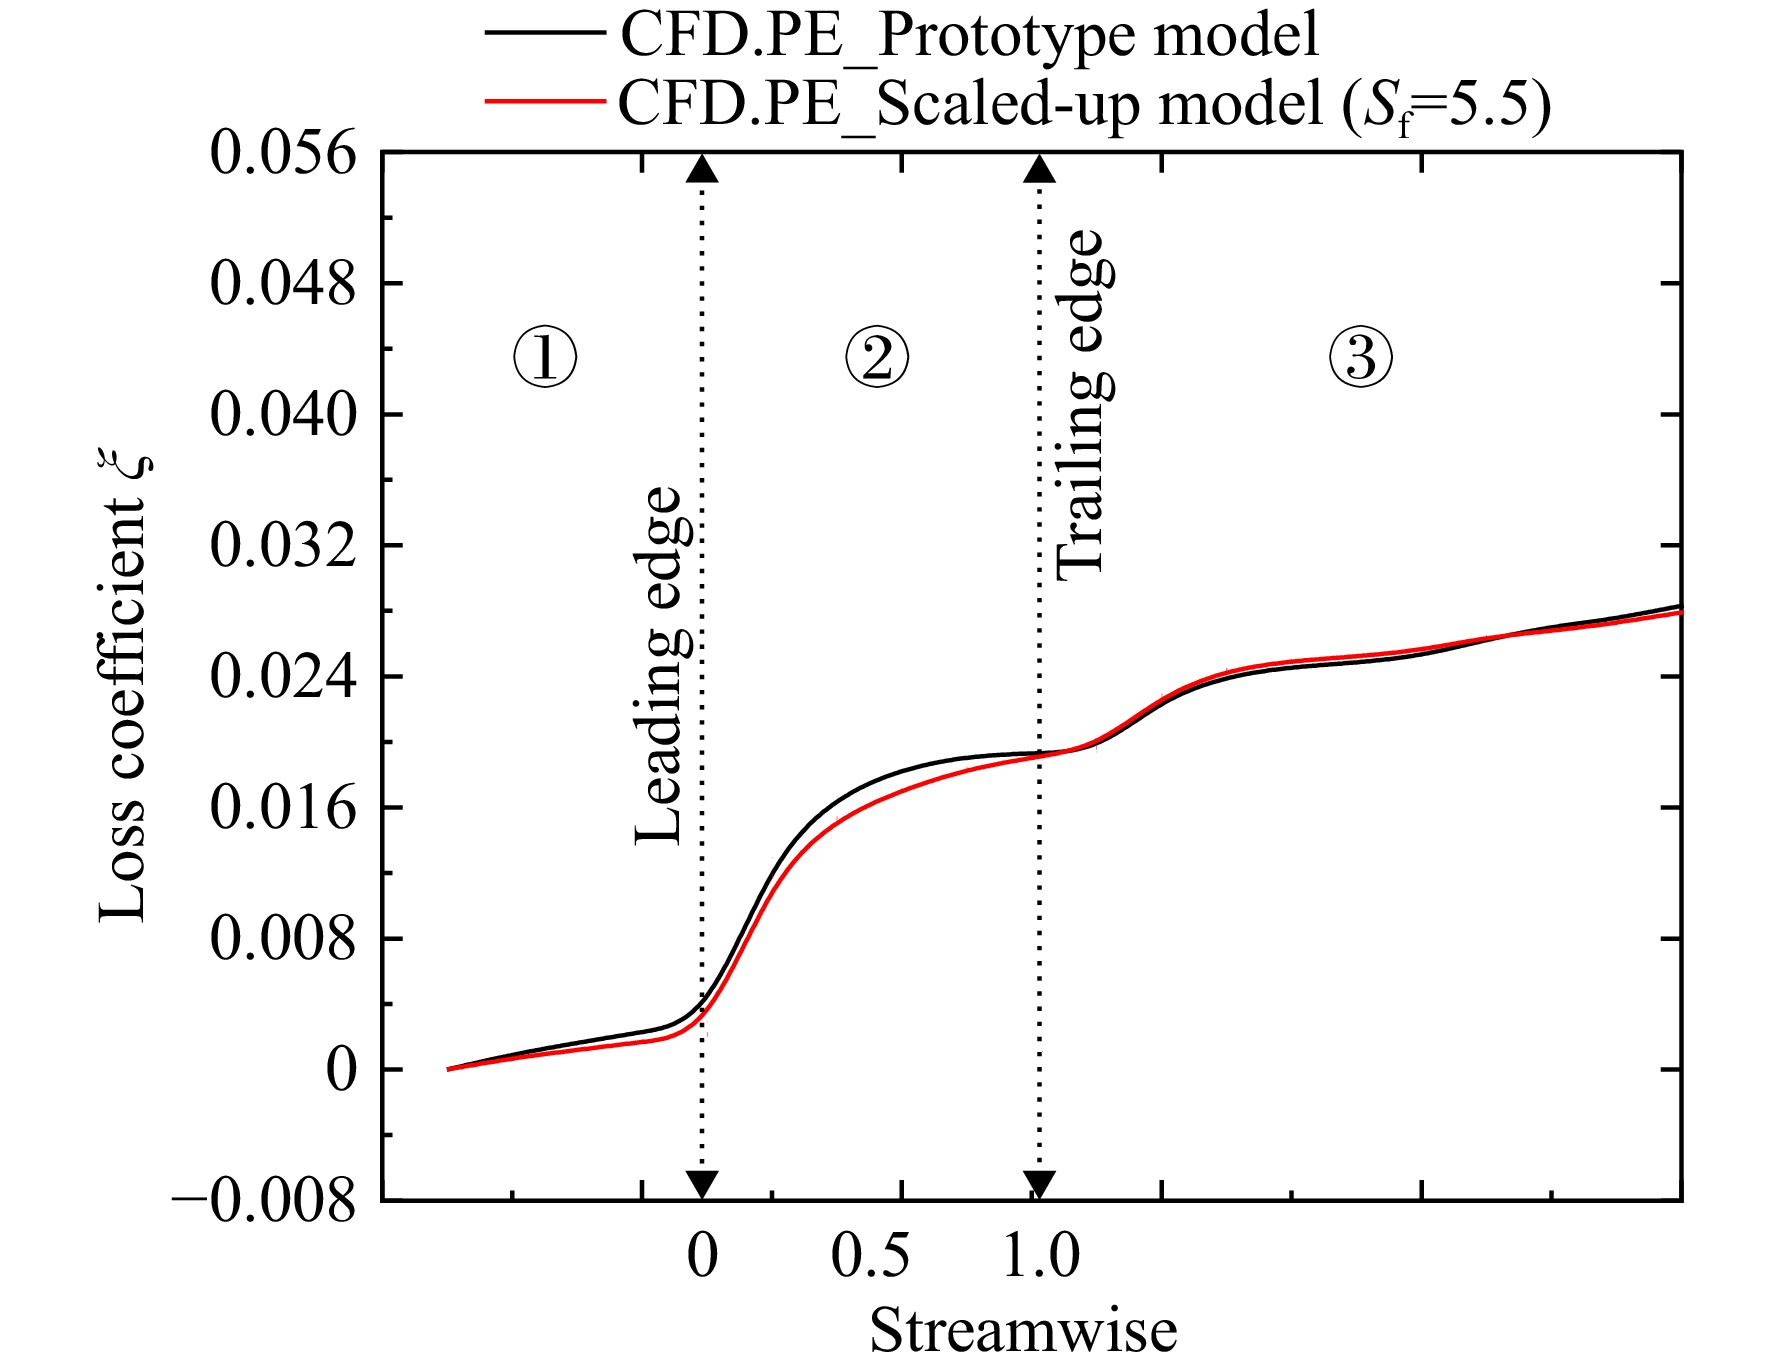
图 20 小/大模型叶尖区域沿轴向熵增曲线(100%设计转速)
Figure 20. Entropy production streamwise distribution in the tip region between the prototype and scaled-up model (100% designed velocity)
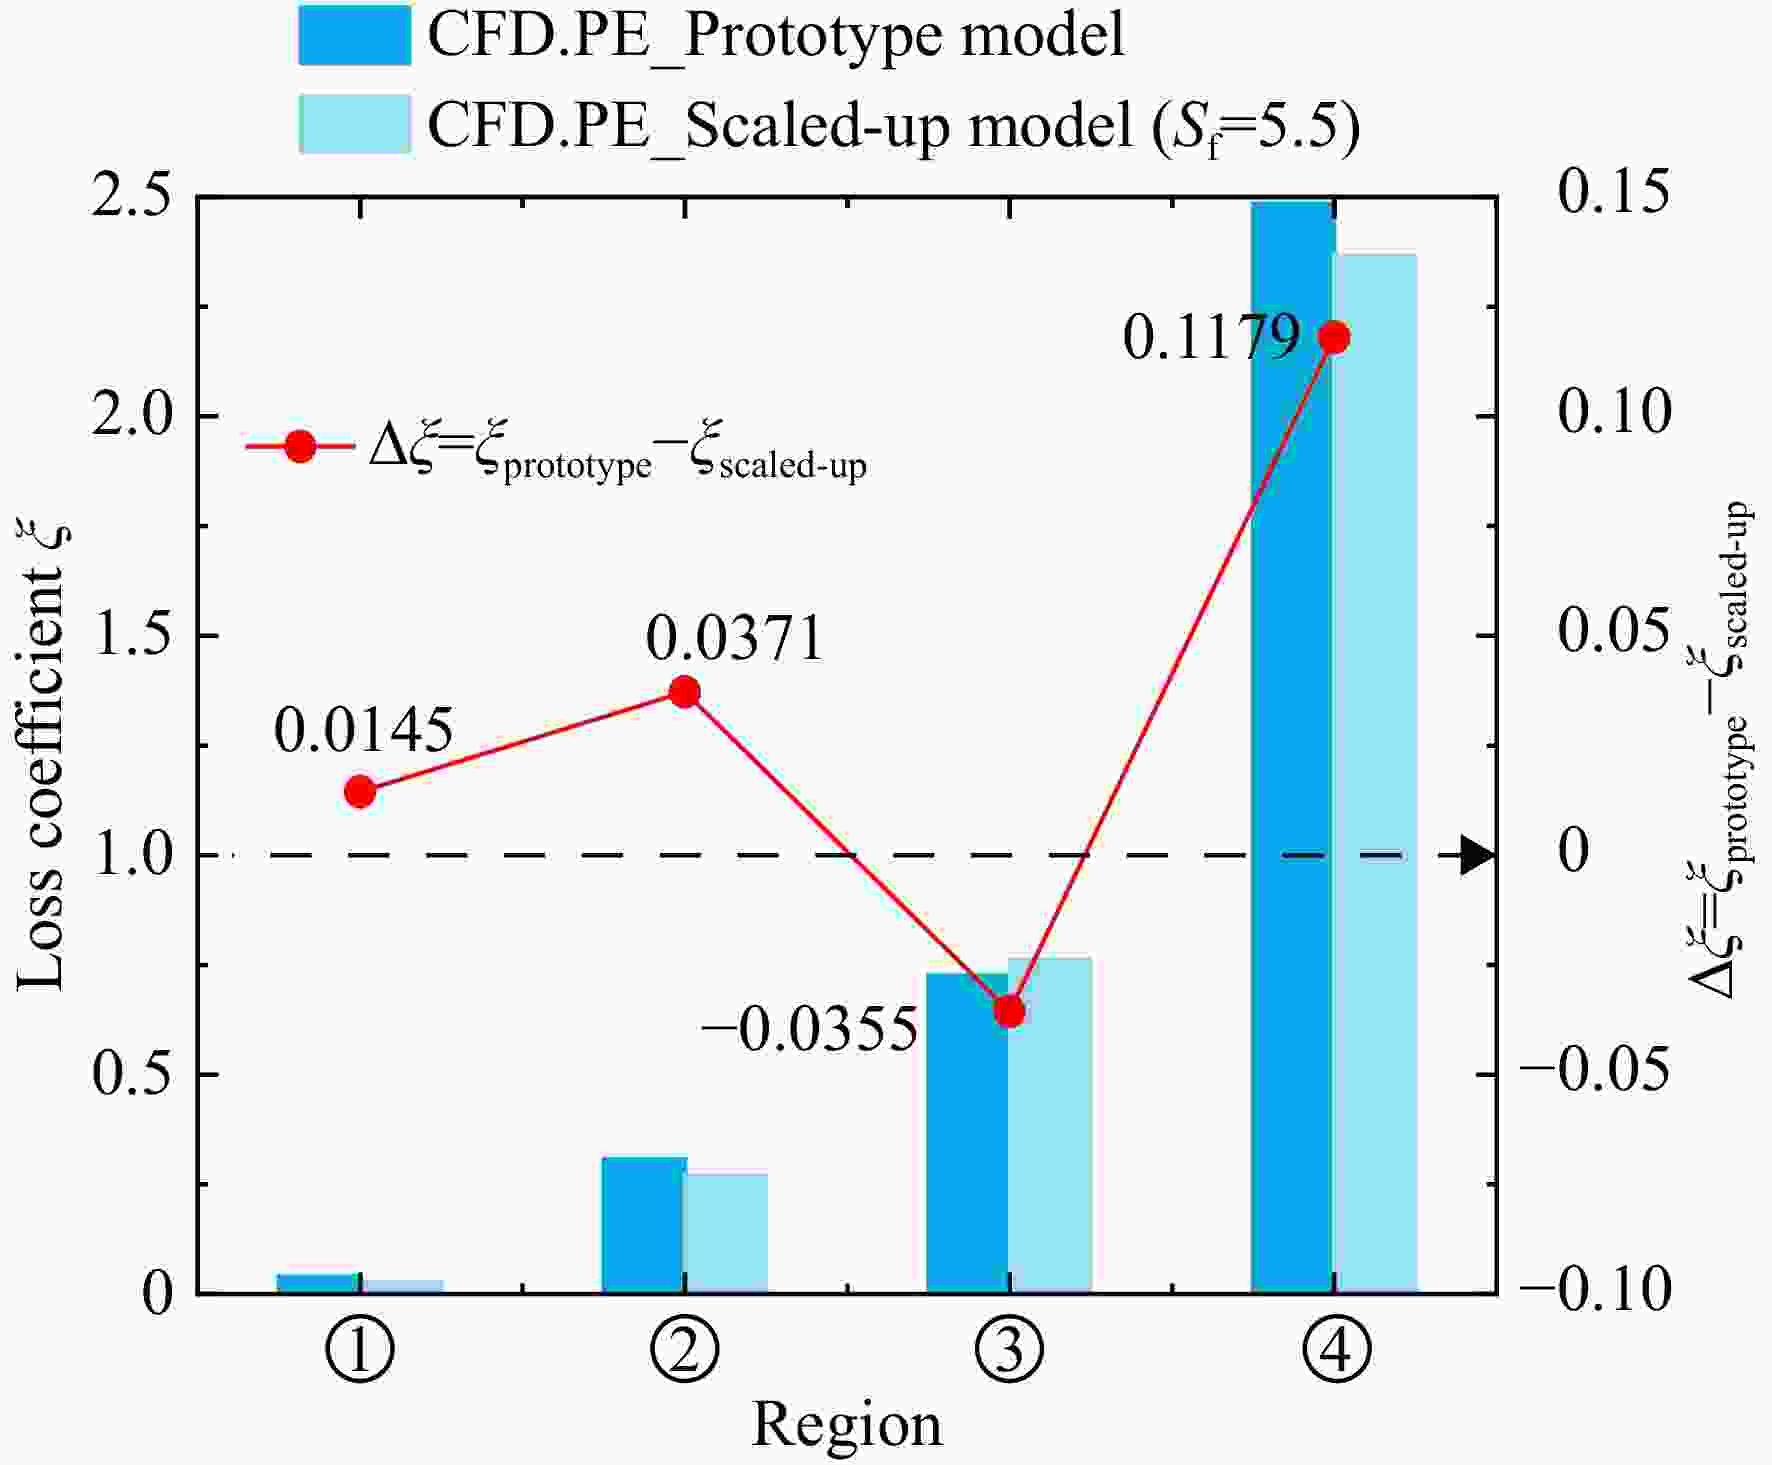
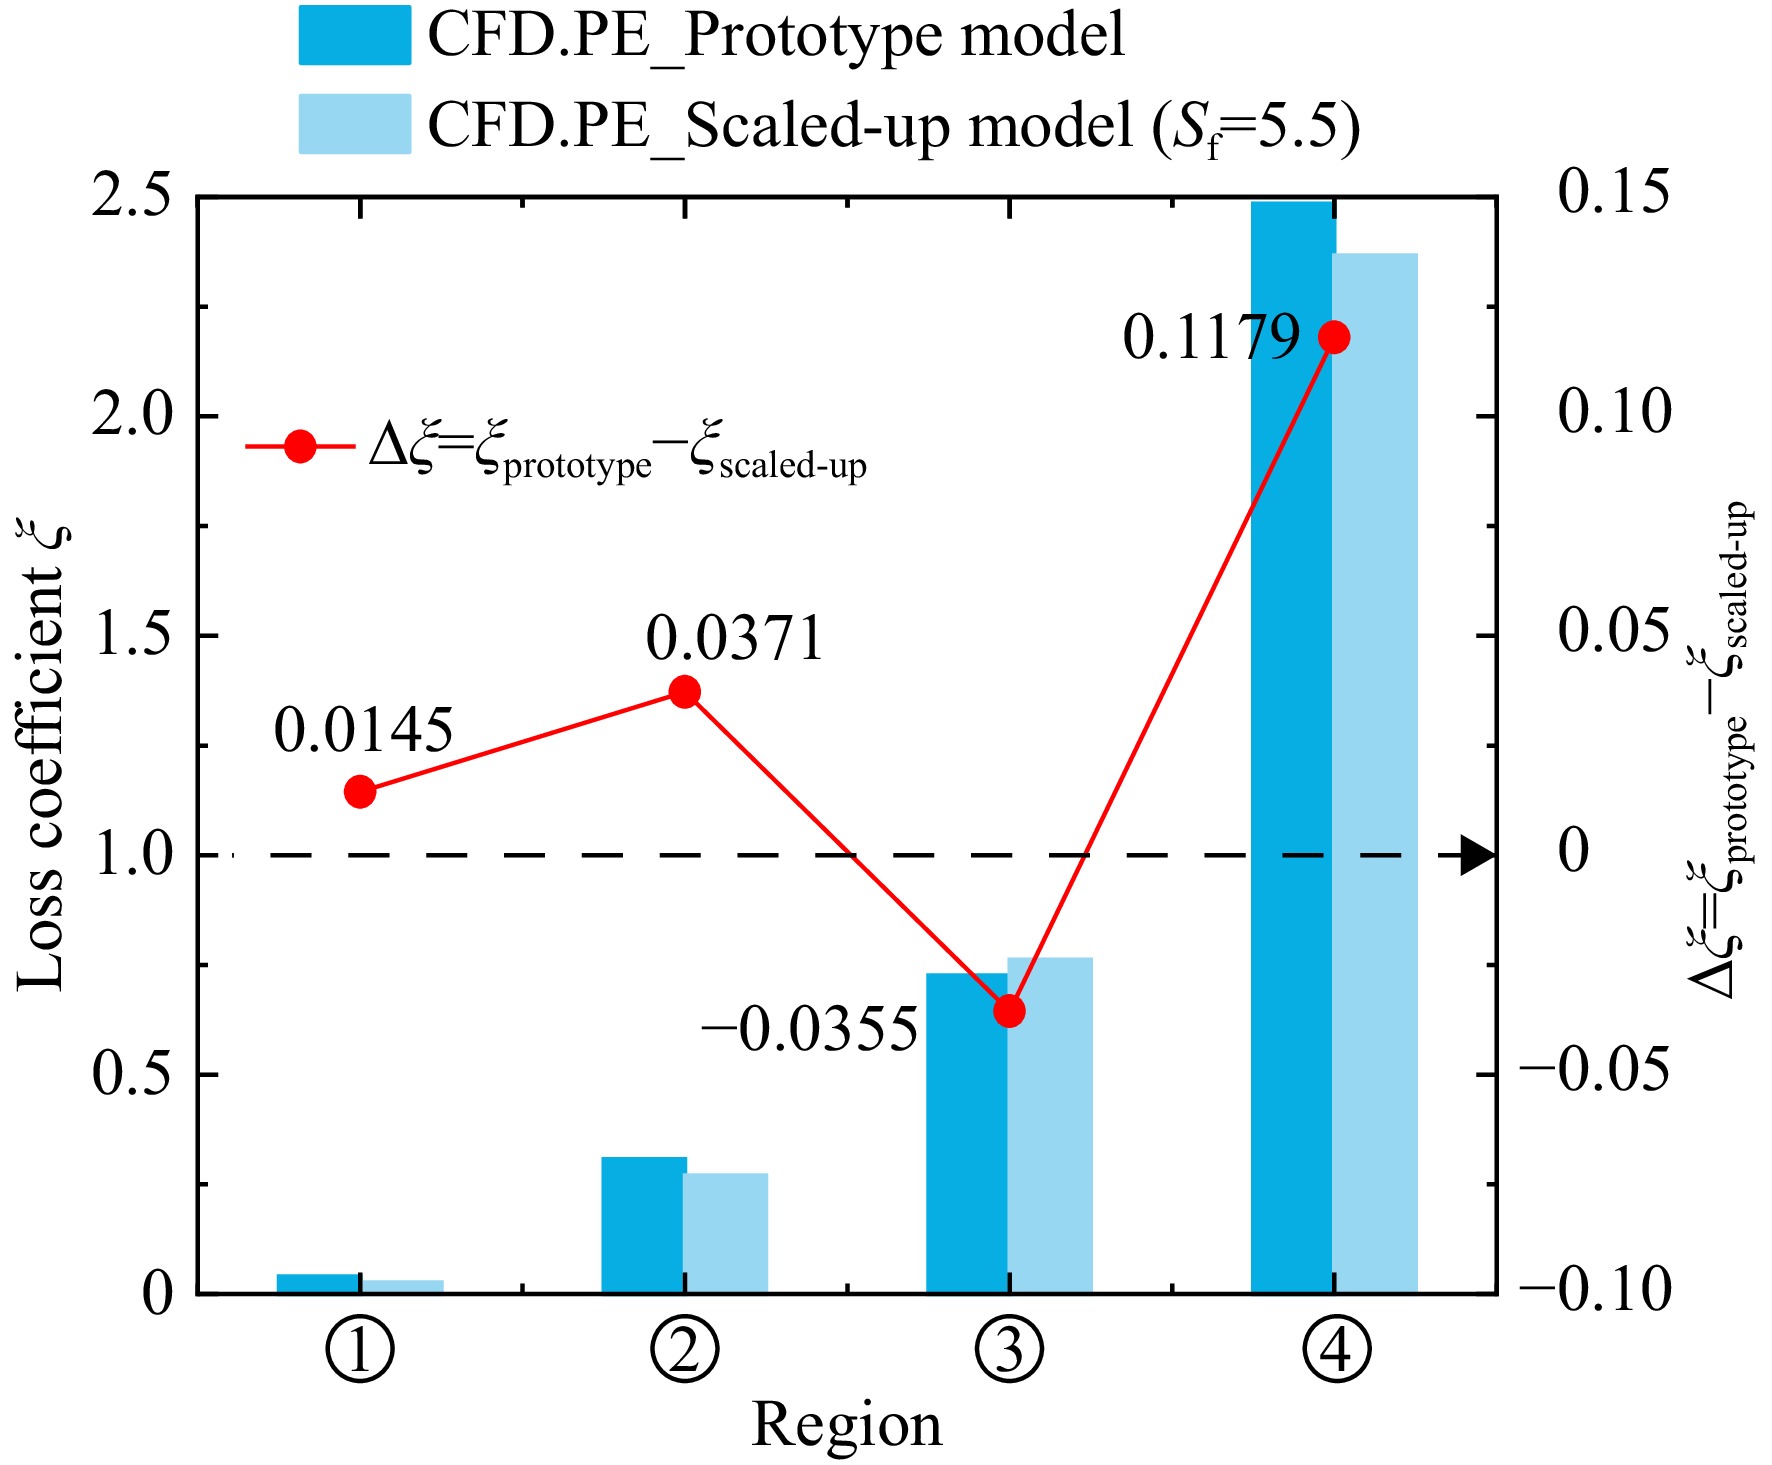
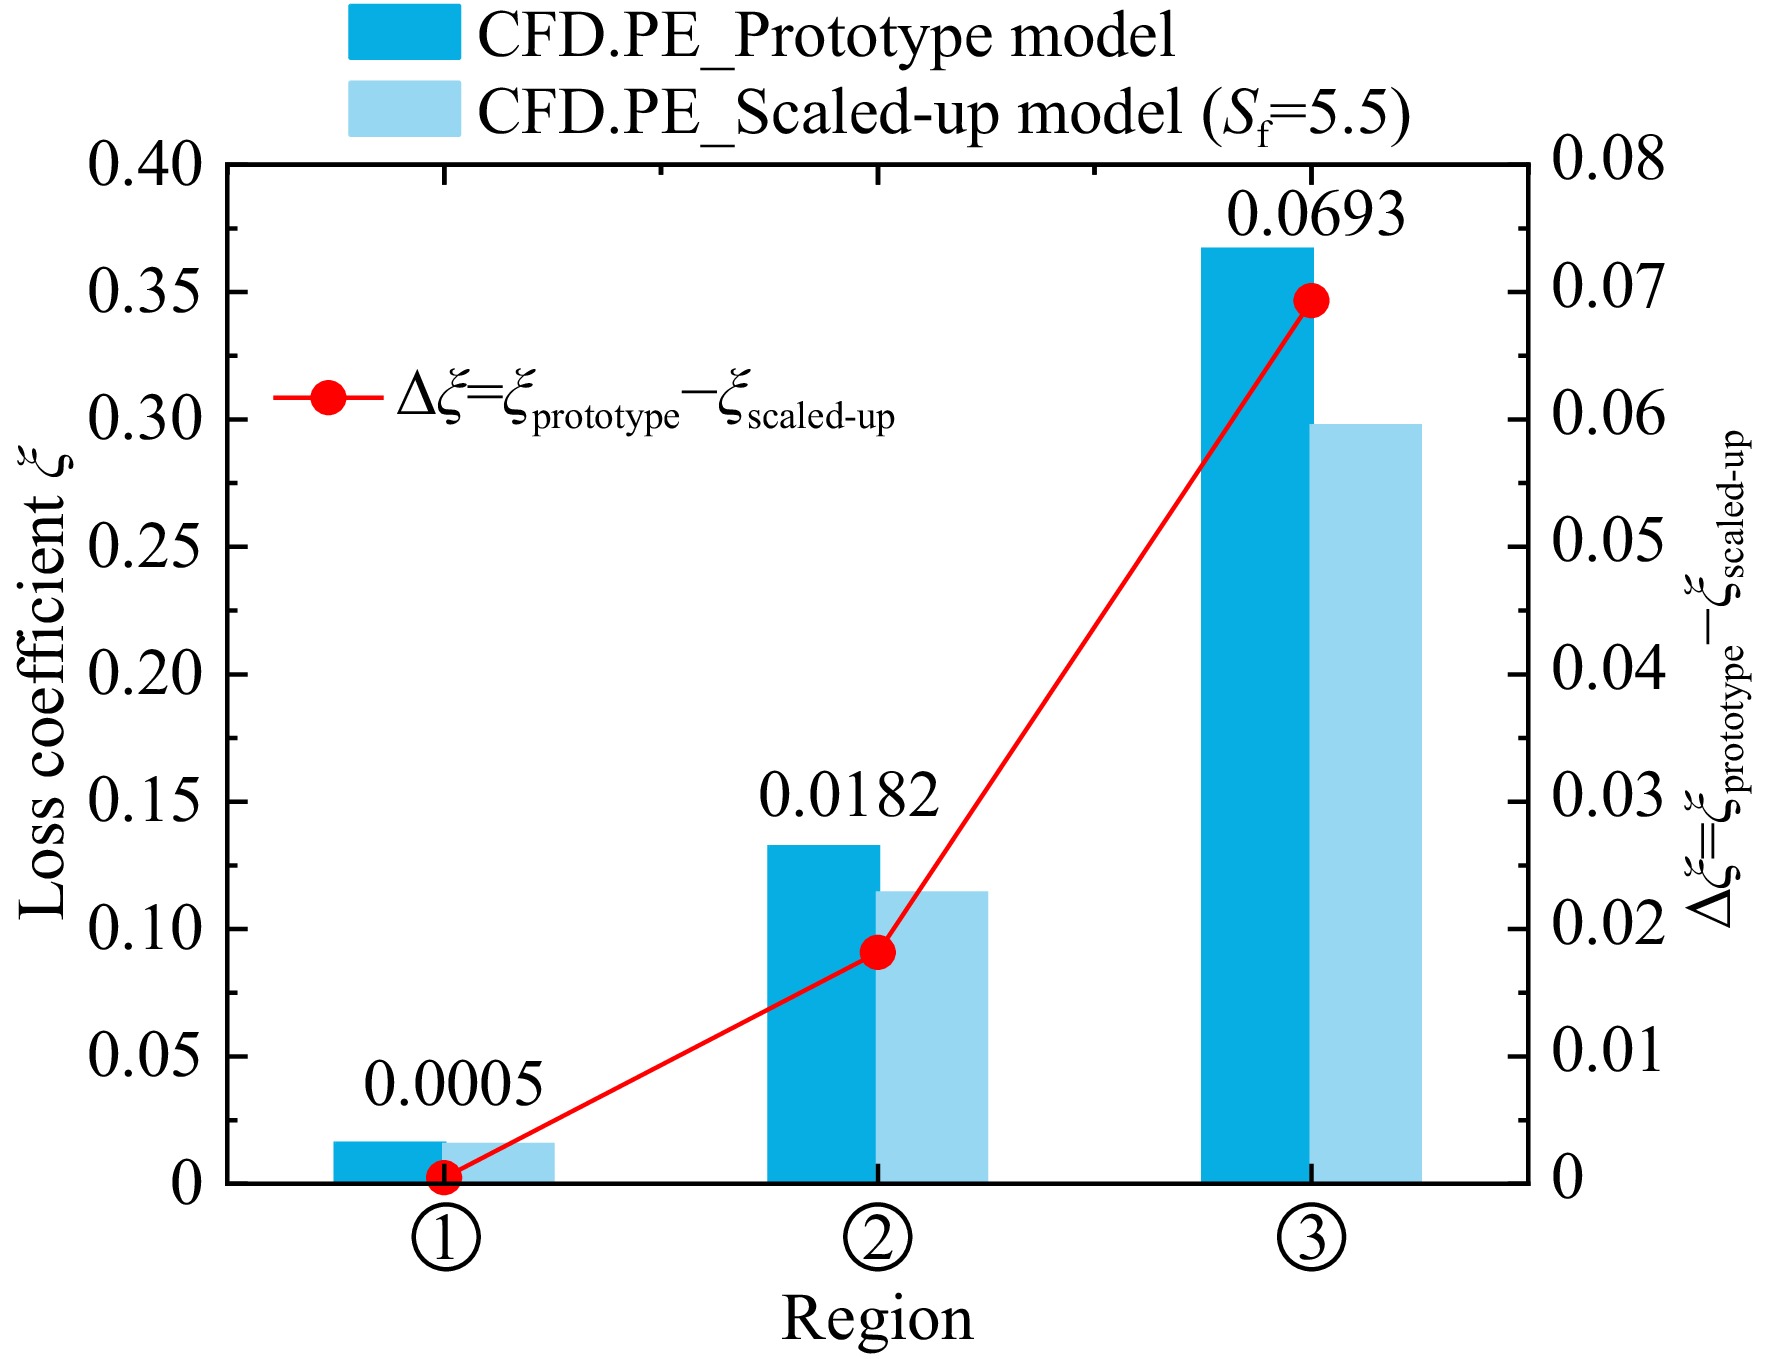
图 21 小/大模型叶尖区域沿轴向损失分布(100%设计转速)
Figure 21. Loss streamwise distribution in the tip region between the prototype and scaled-up model (100% designed velocity)
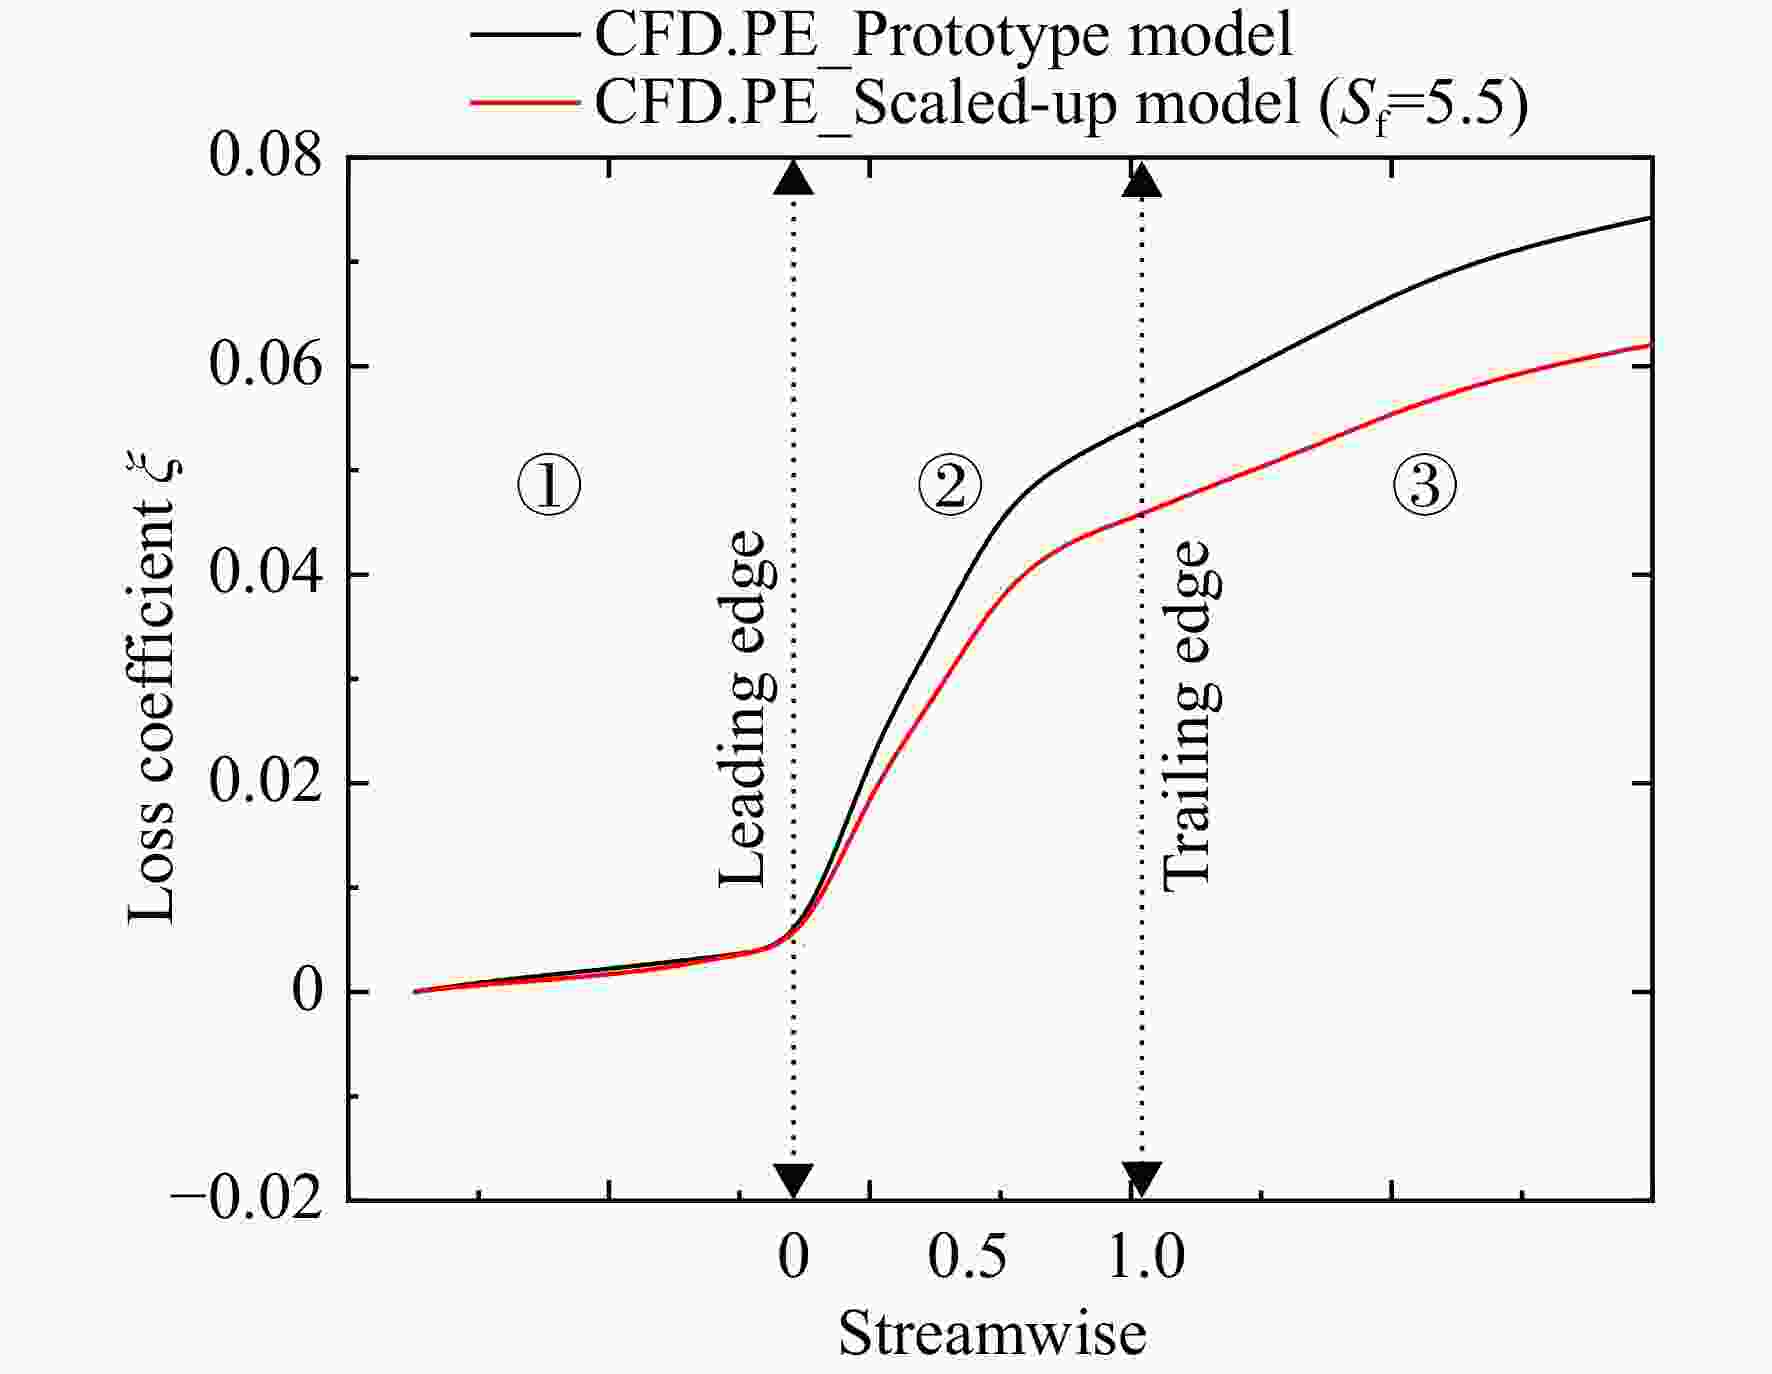
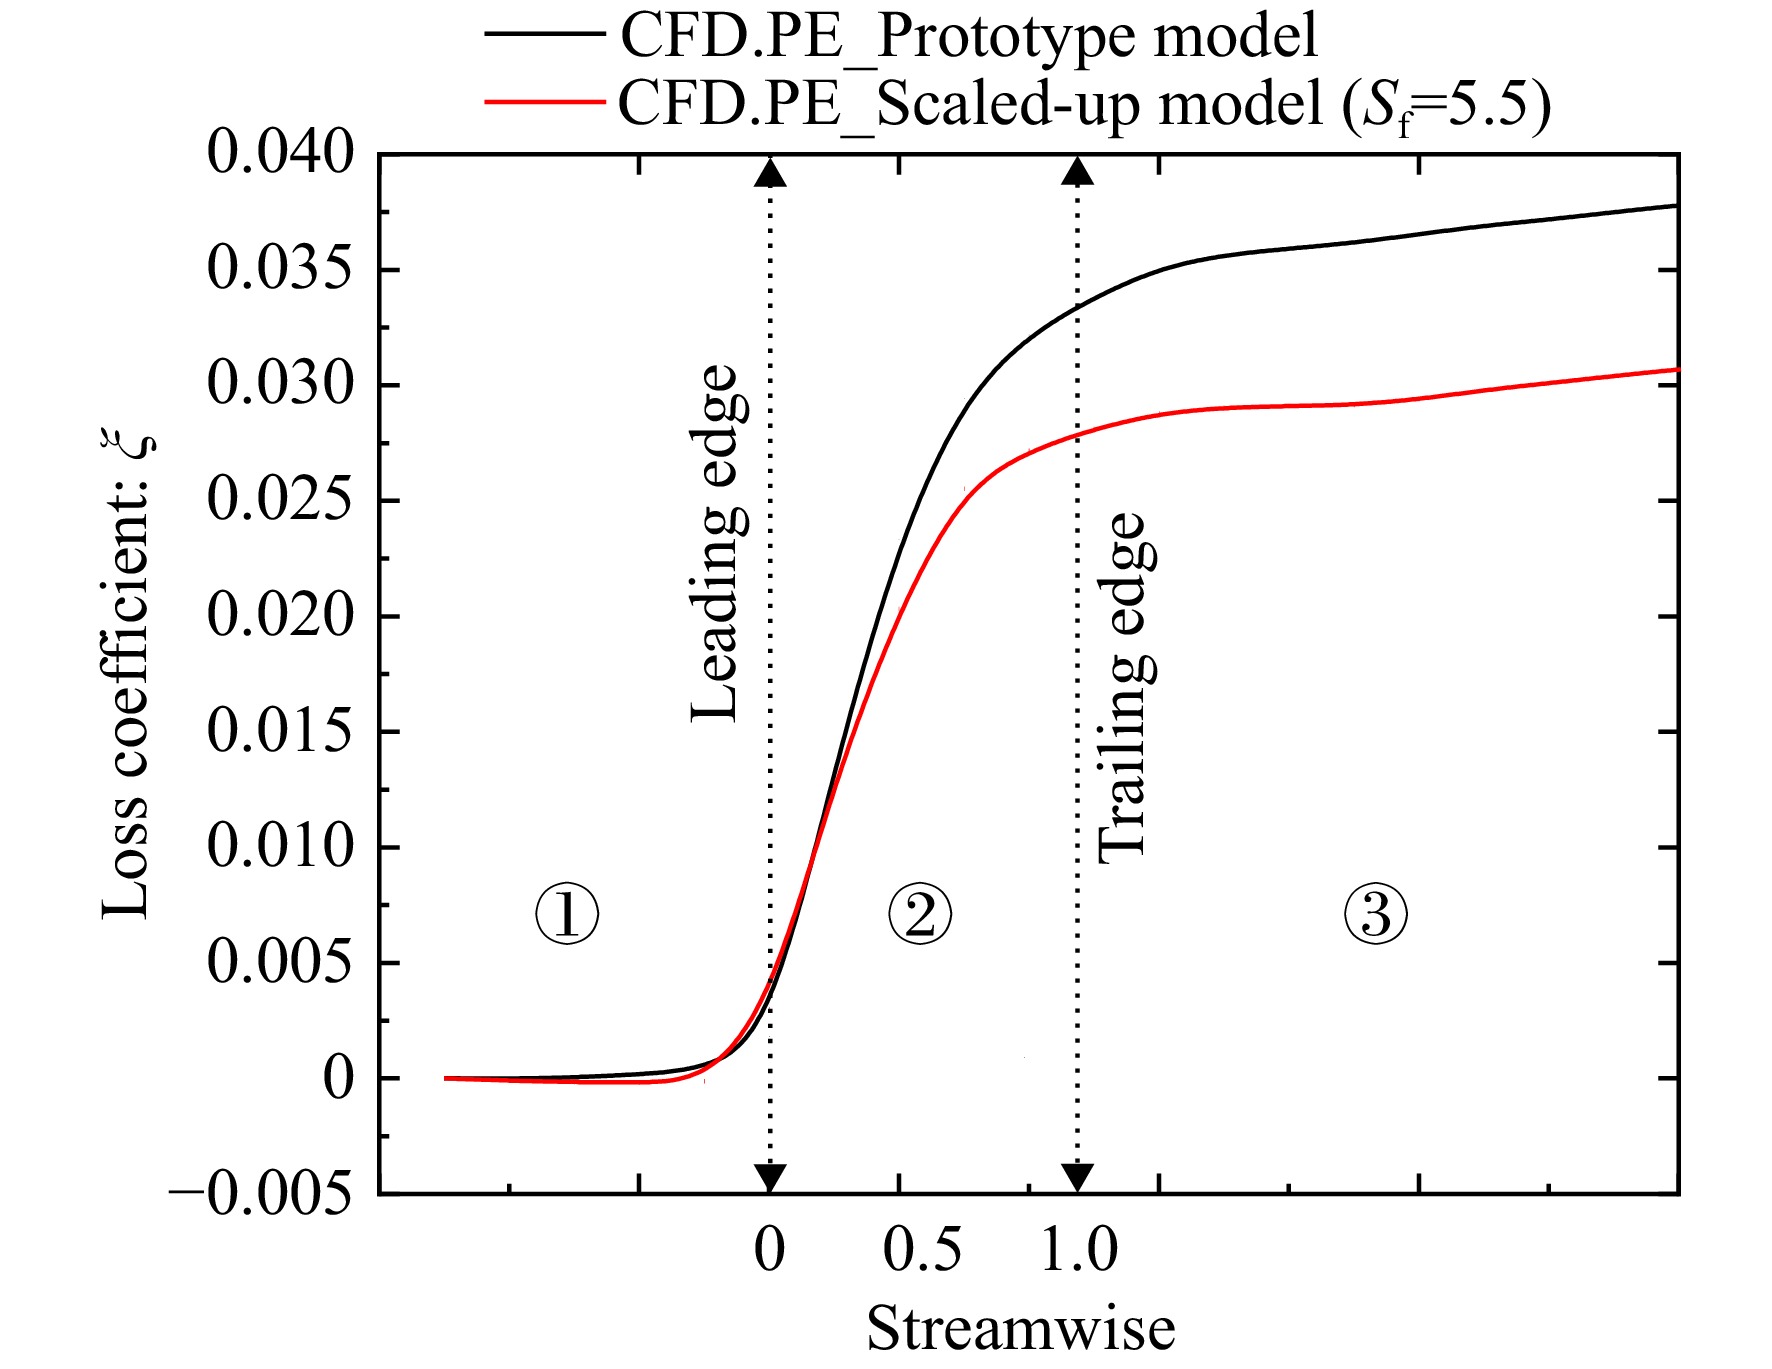
图 22 小/大模型叶尖区域沿轴向熵增曲线(50%设计转速)
Figure 22. Entropy production streamwise distribution in the tip region between the prototype and scaled-up model (50% designed velocity)
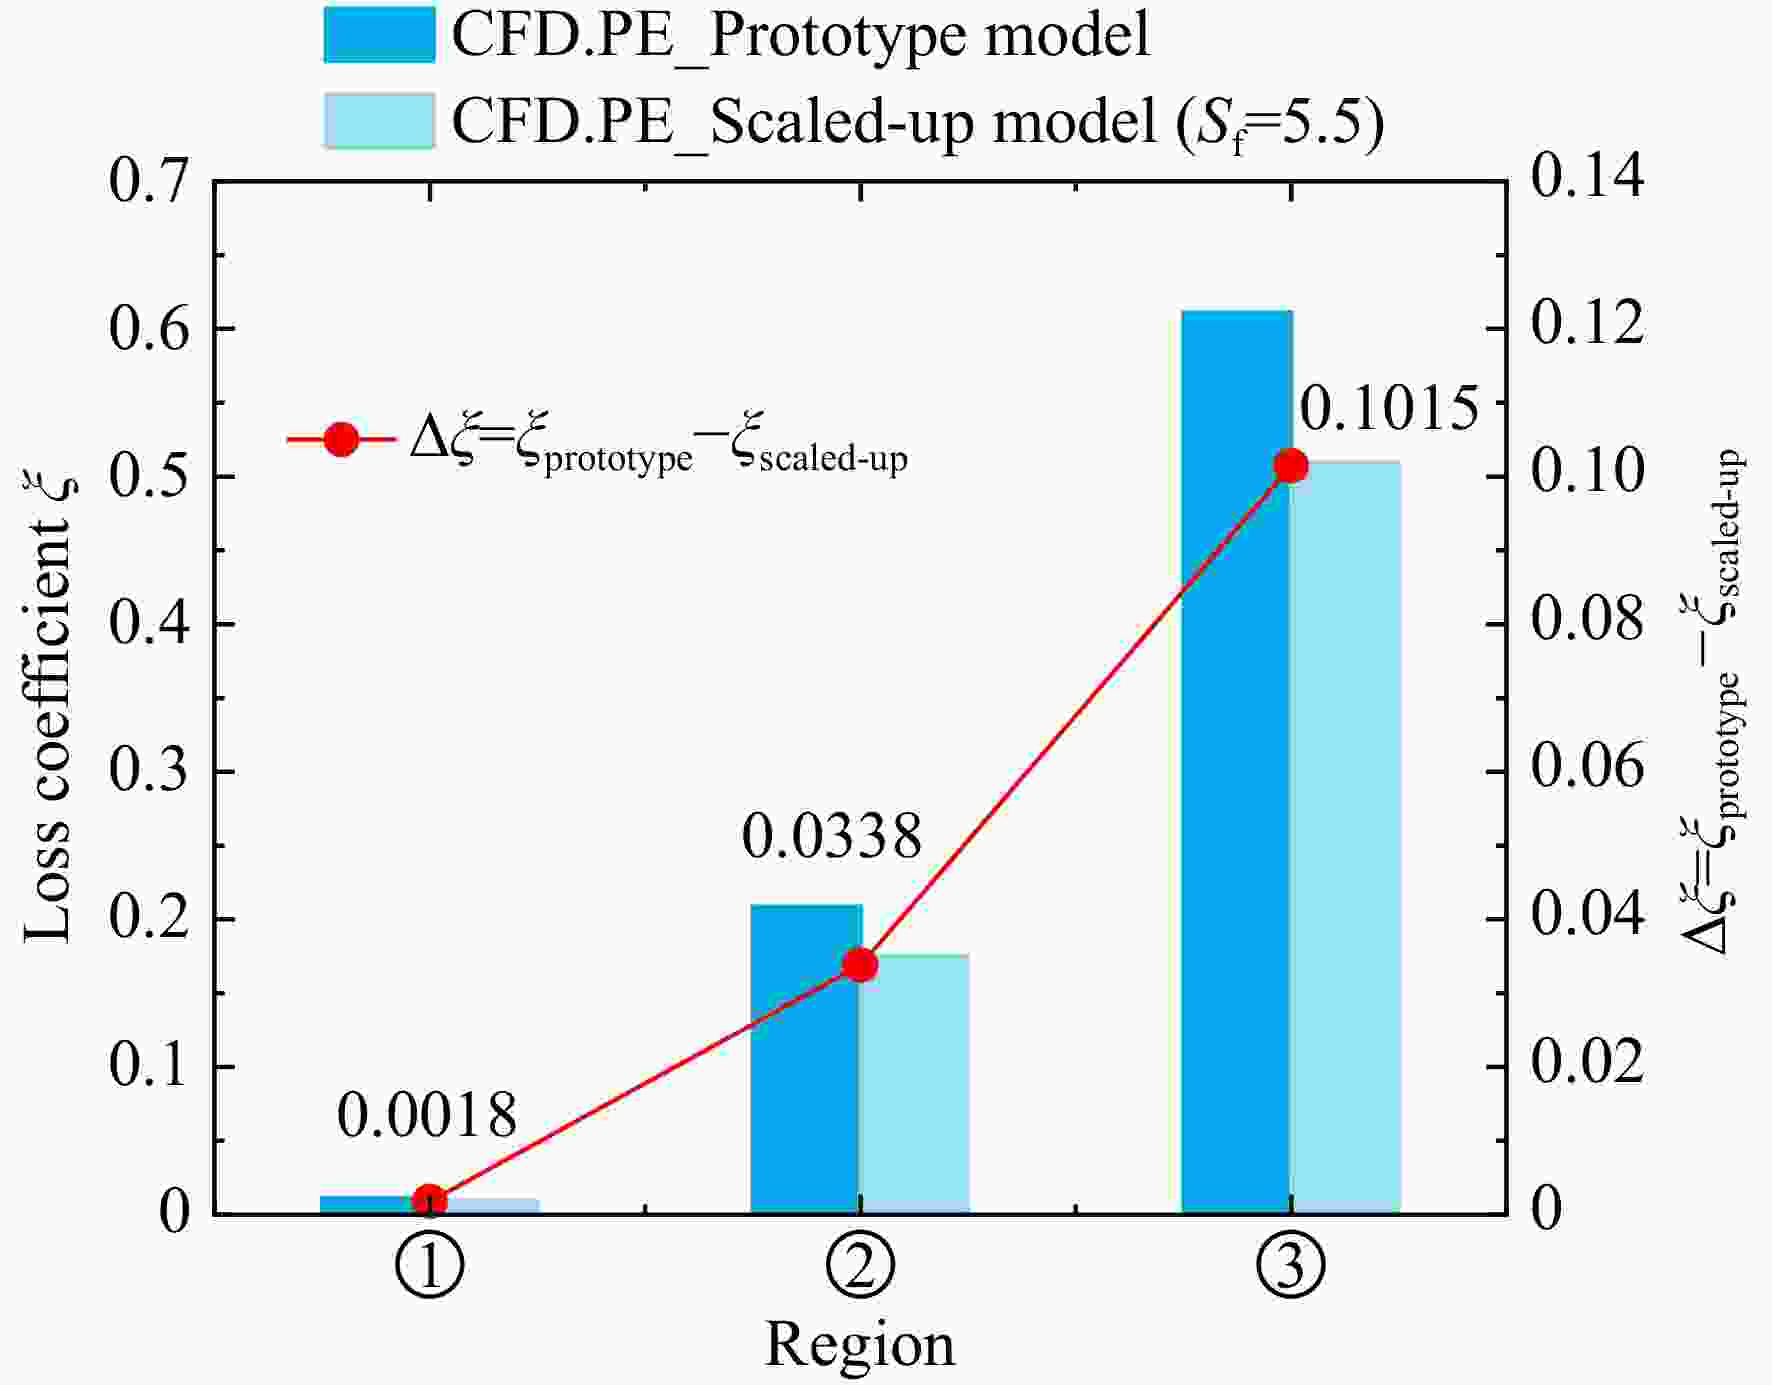
图 23 小/大模型叶尖区域沿轴向损失分布(50%设计转速)
Figure 23. Comparison of loss streamwise distribution in the tip region between the prototype and scaled-up model (50% designed velocity)
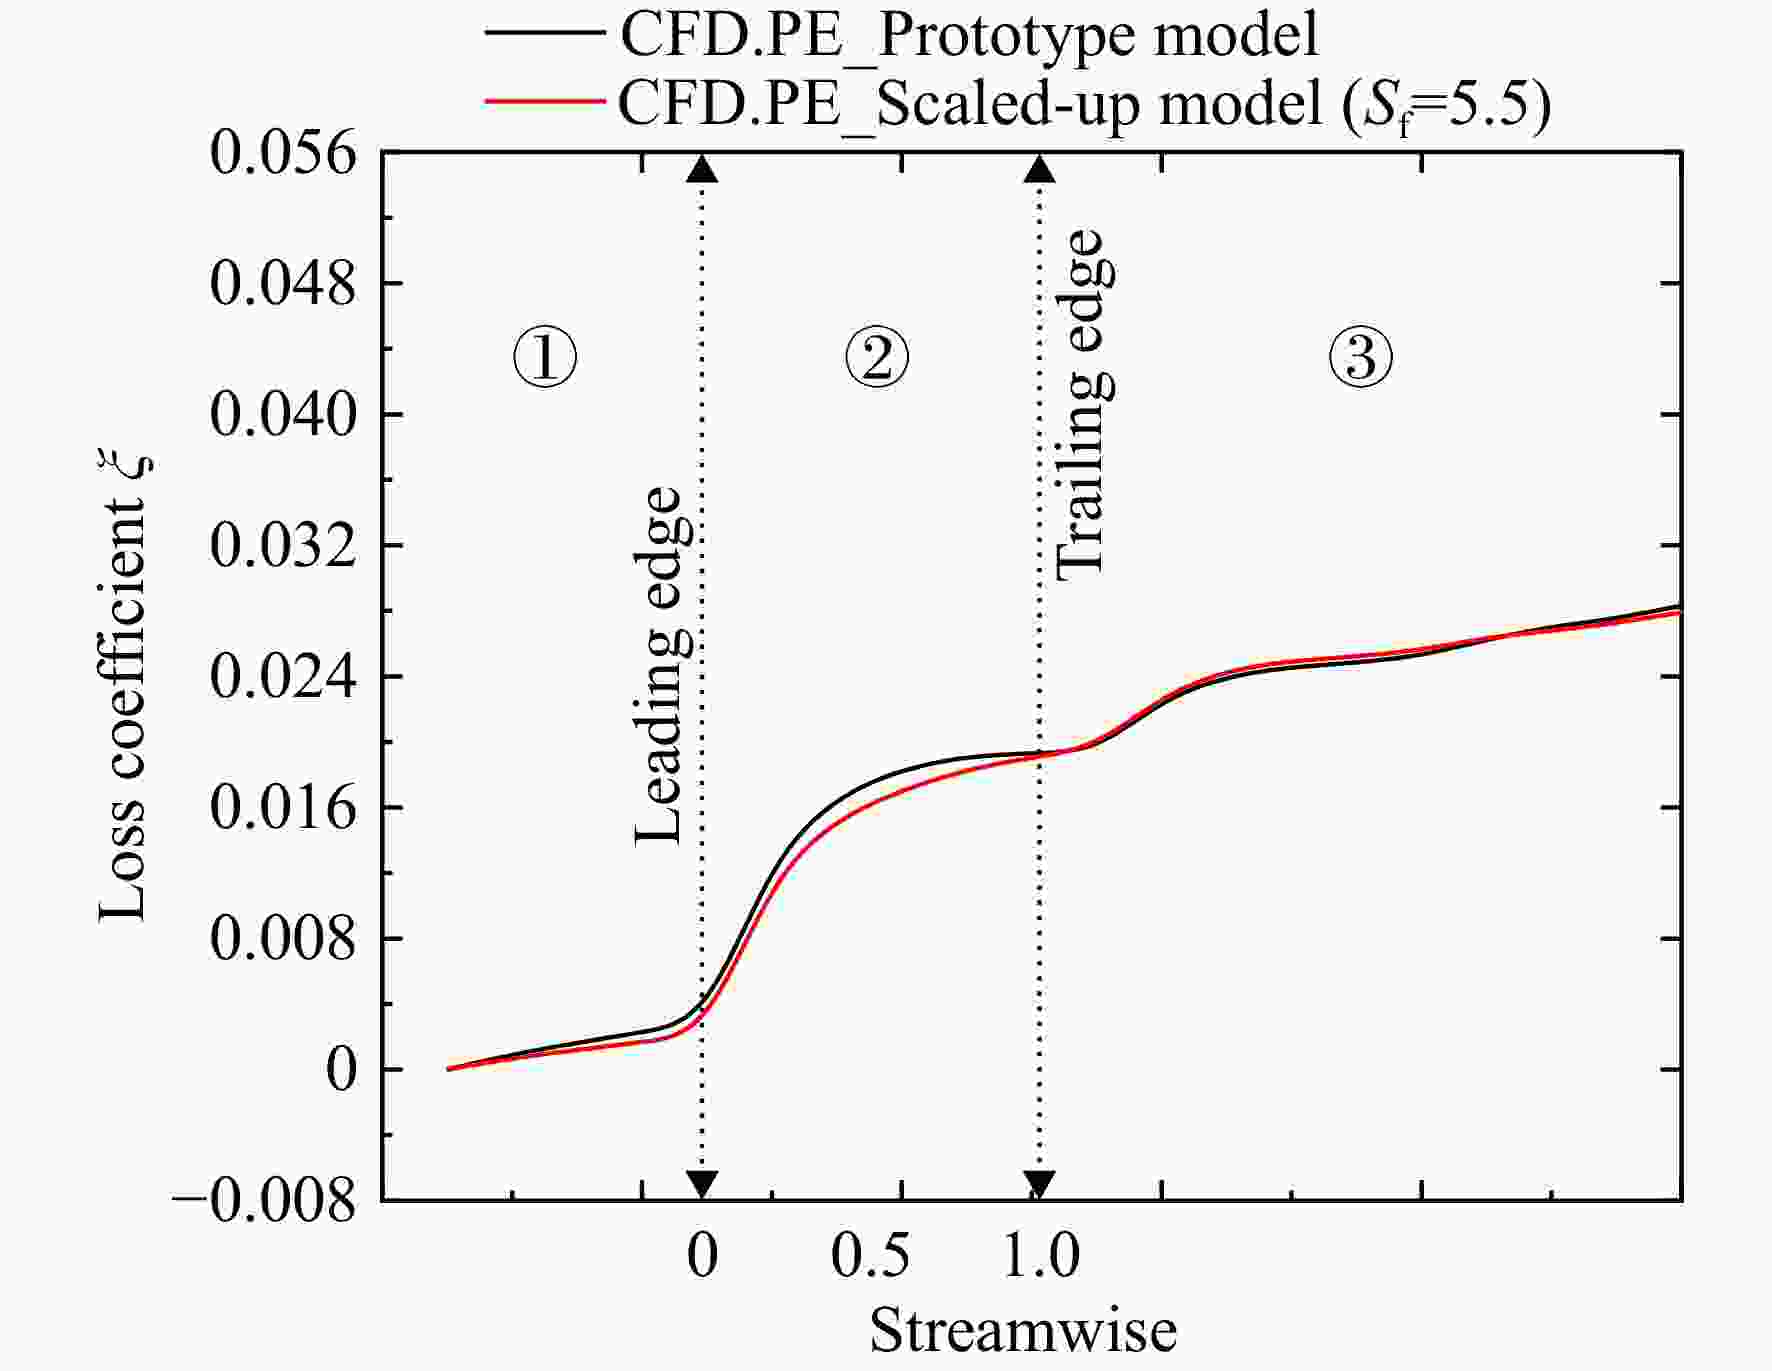
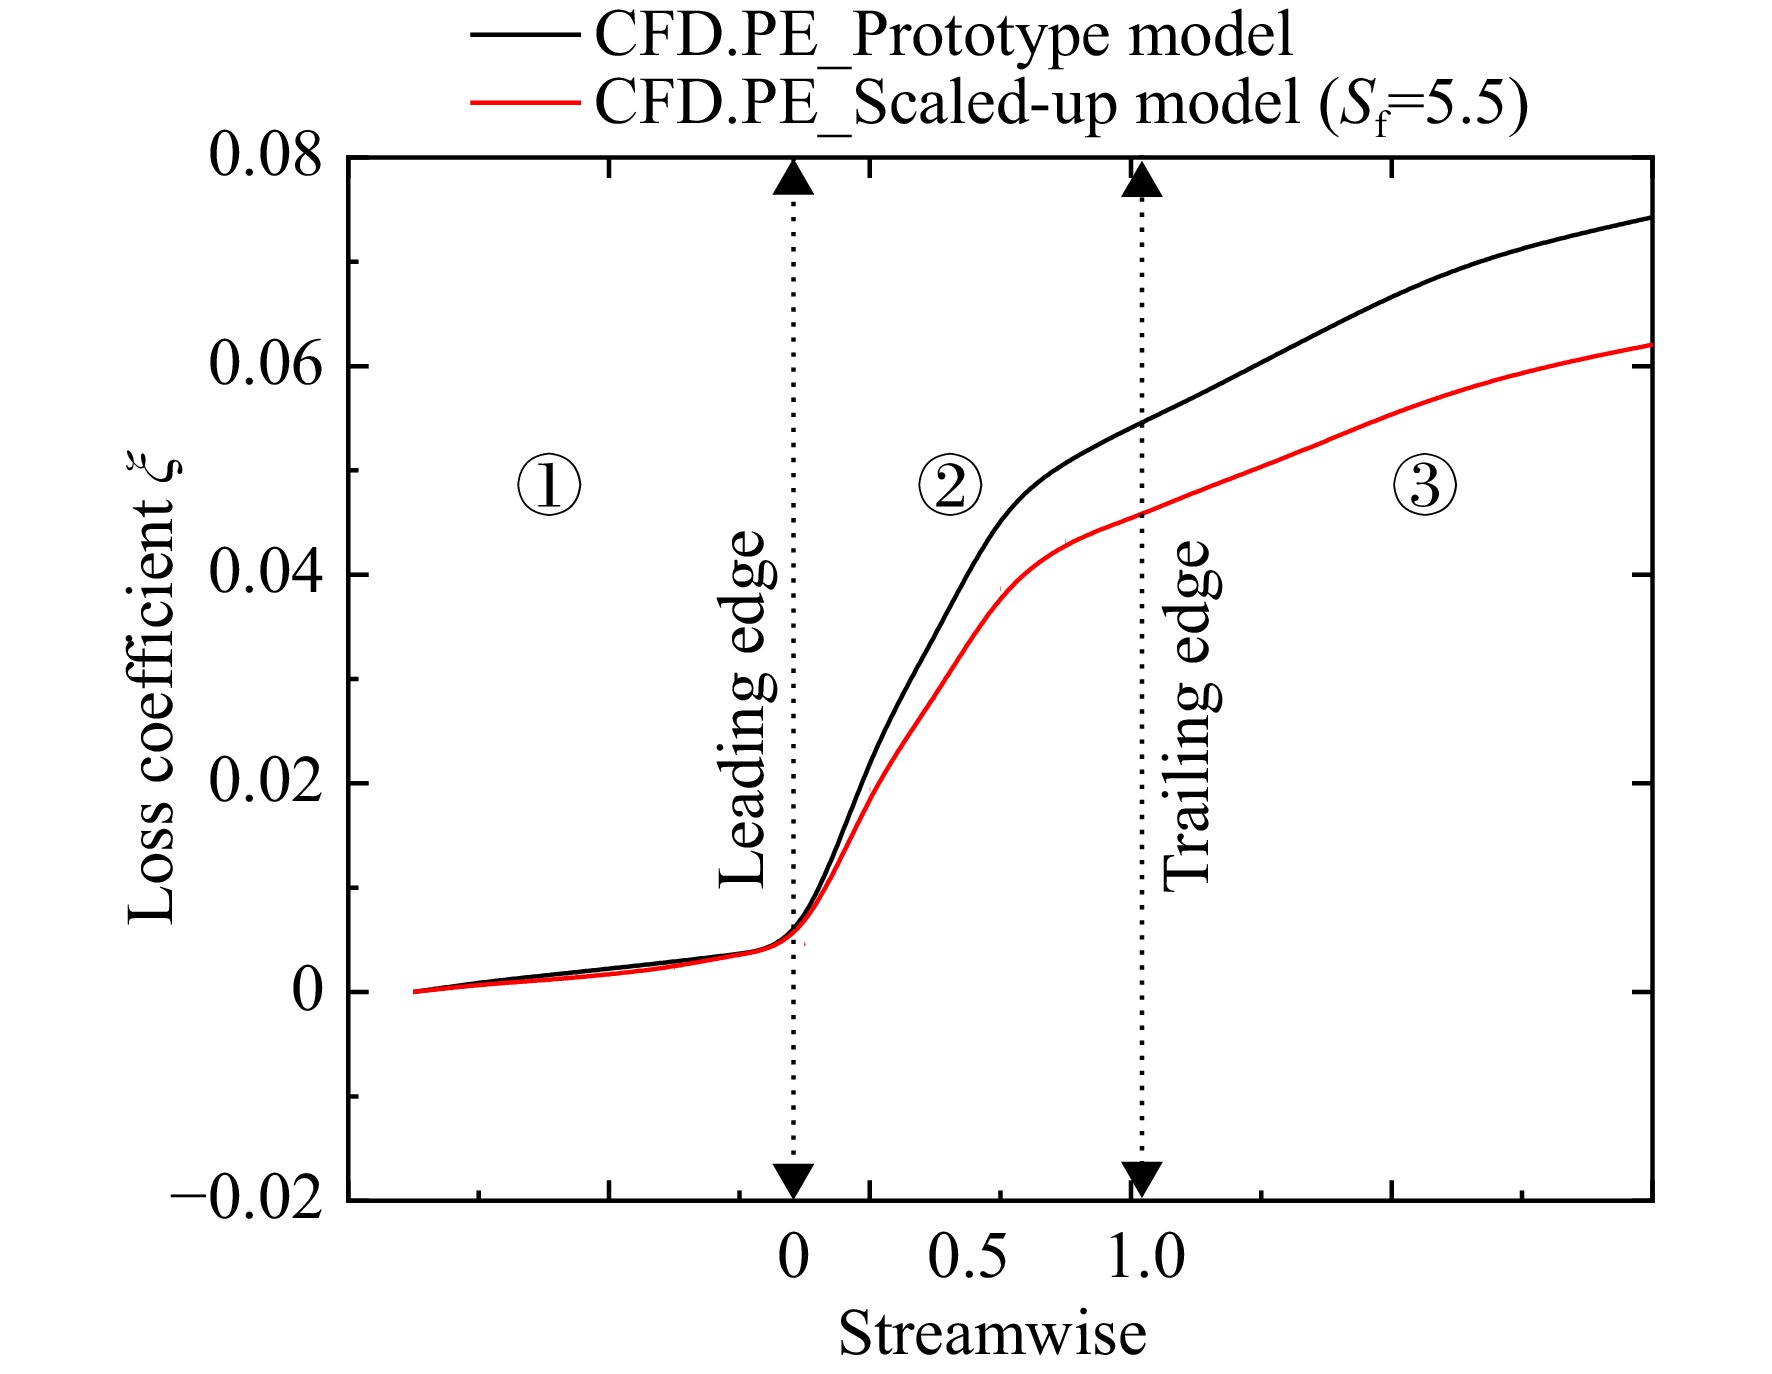
图 24 小/大模型叶根区域沿轴向熵增曲线
Figure 24. Comparison of entropy production streamwise distribution in the root region between the prototype and scaled-up model
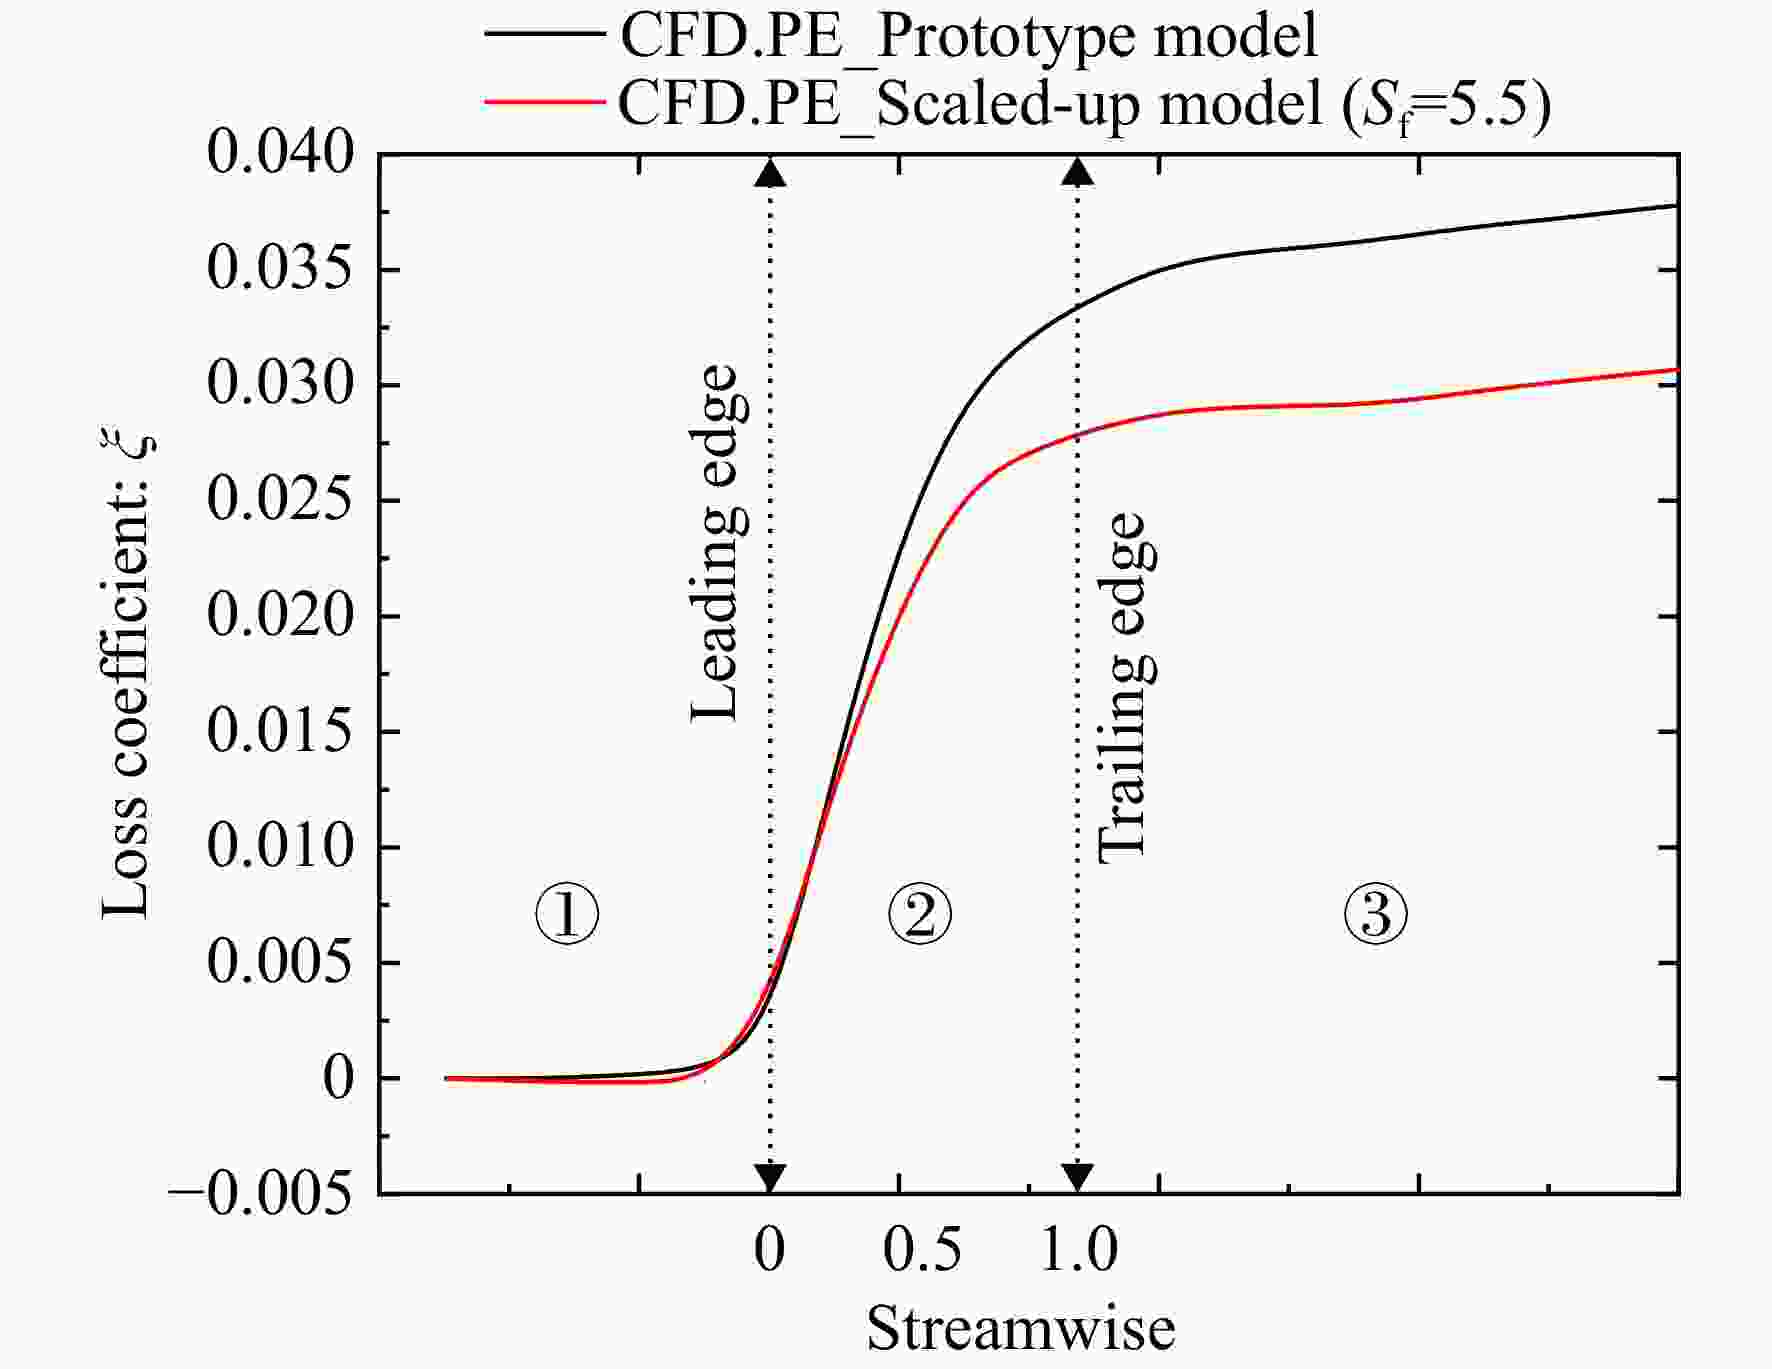
图 25 小/大模型20%~80%叶高沿轴向熵增曲线
Figure 25. Comparison of entropy production streamwise distribution in the 20%—80% spanwise between the prototype and scaled-up model
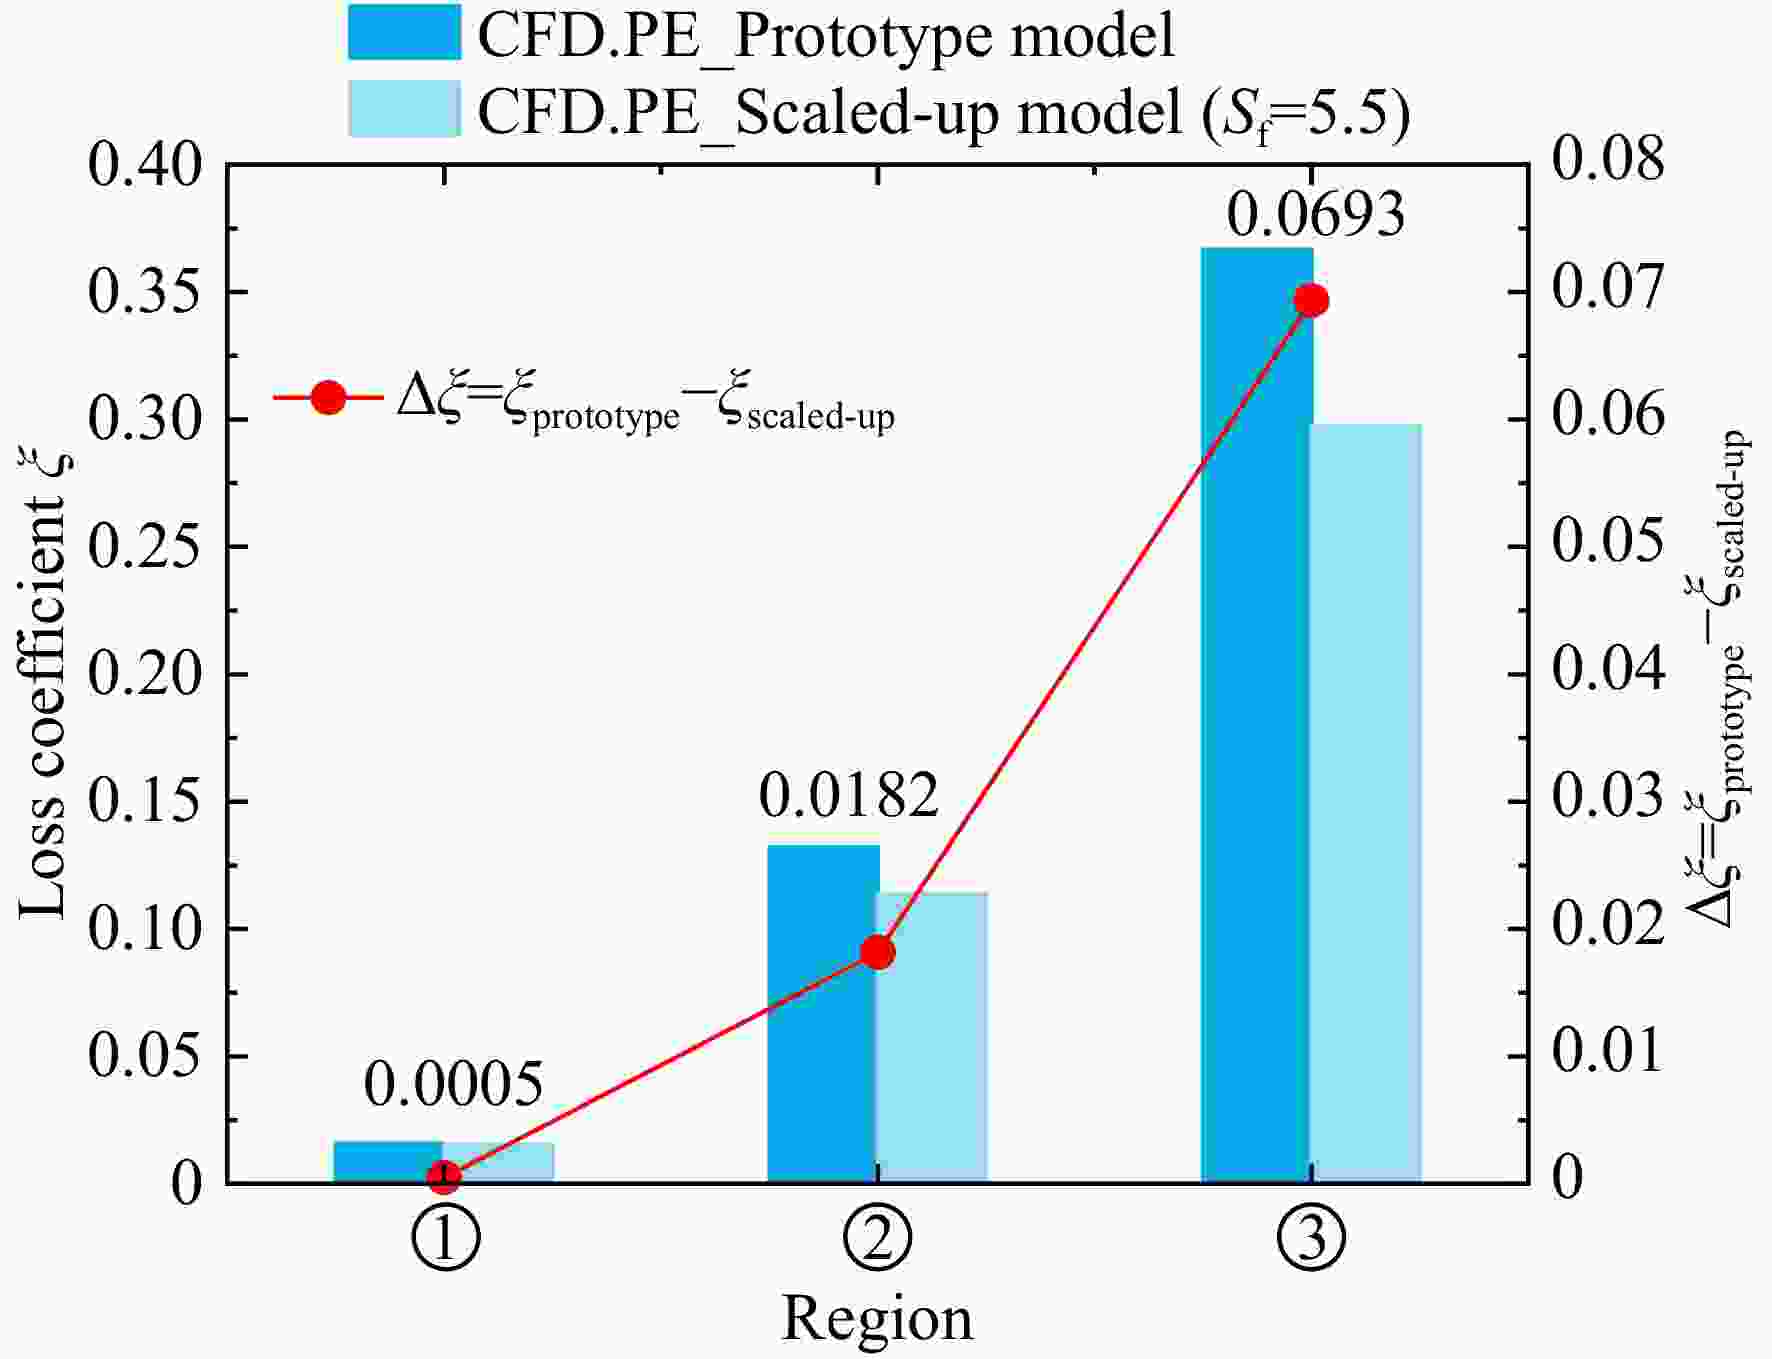
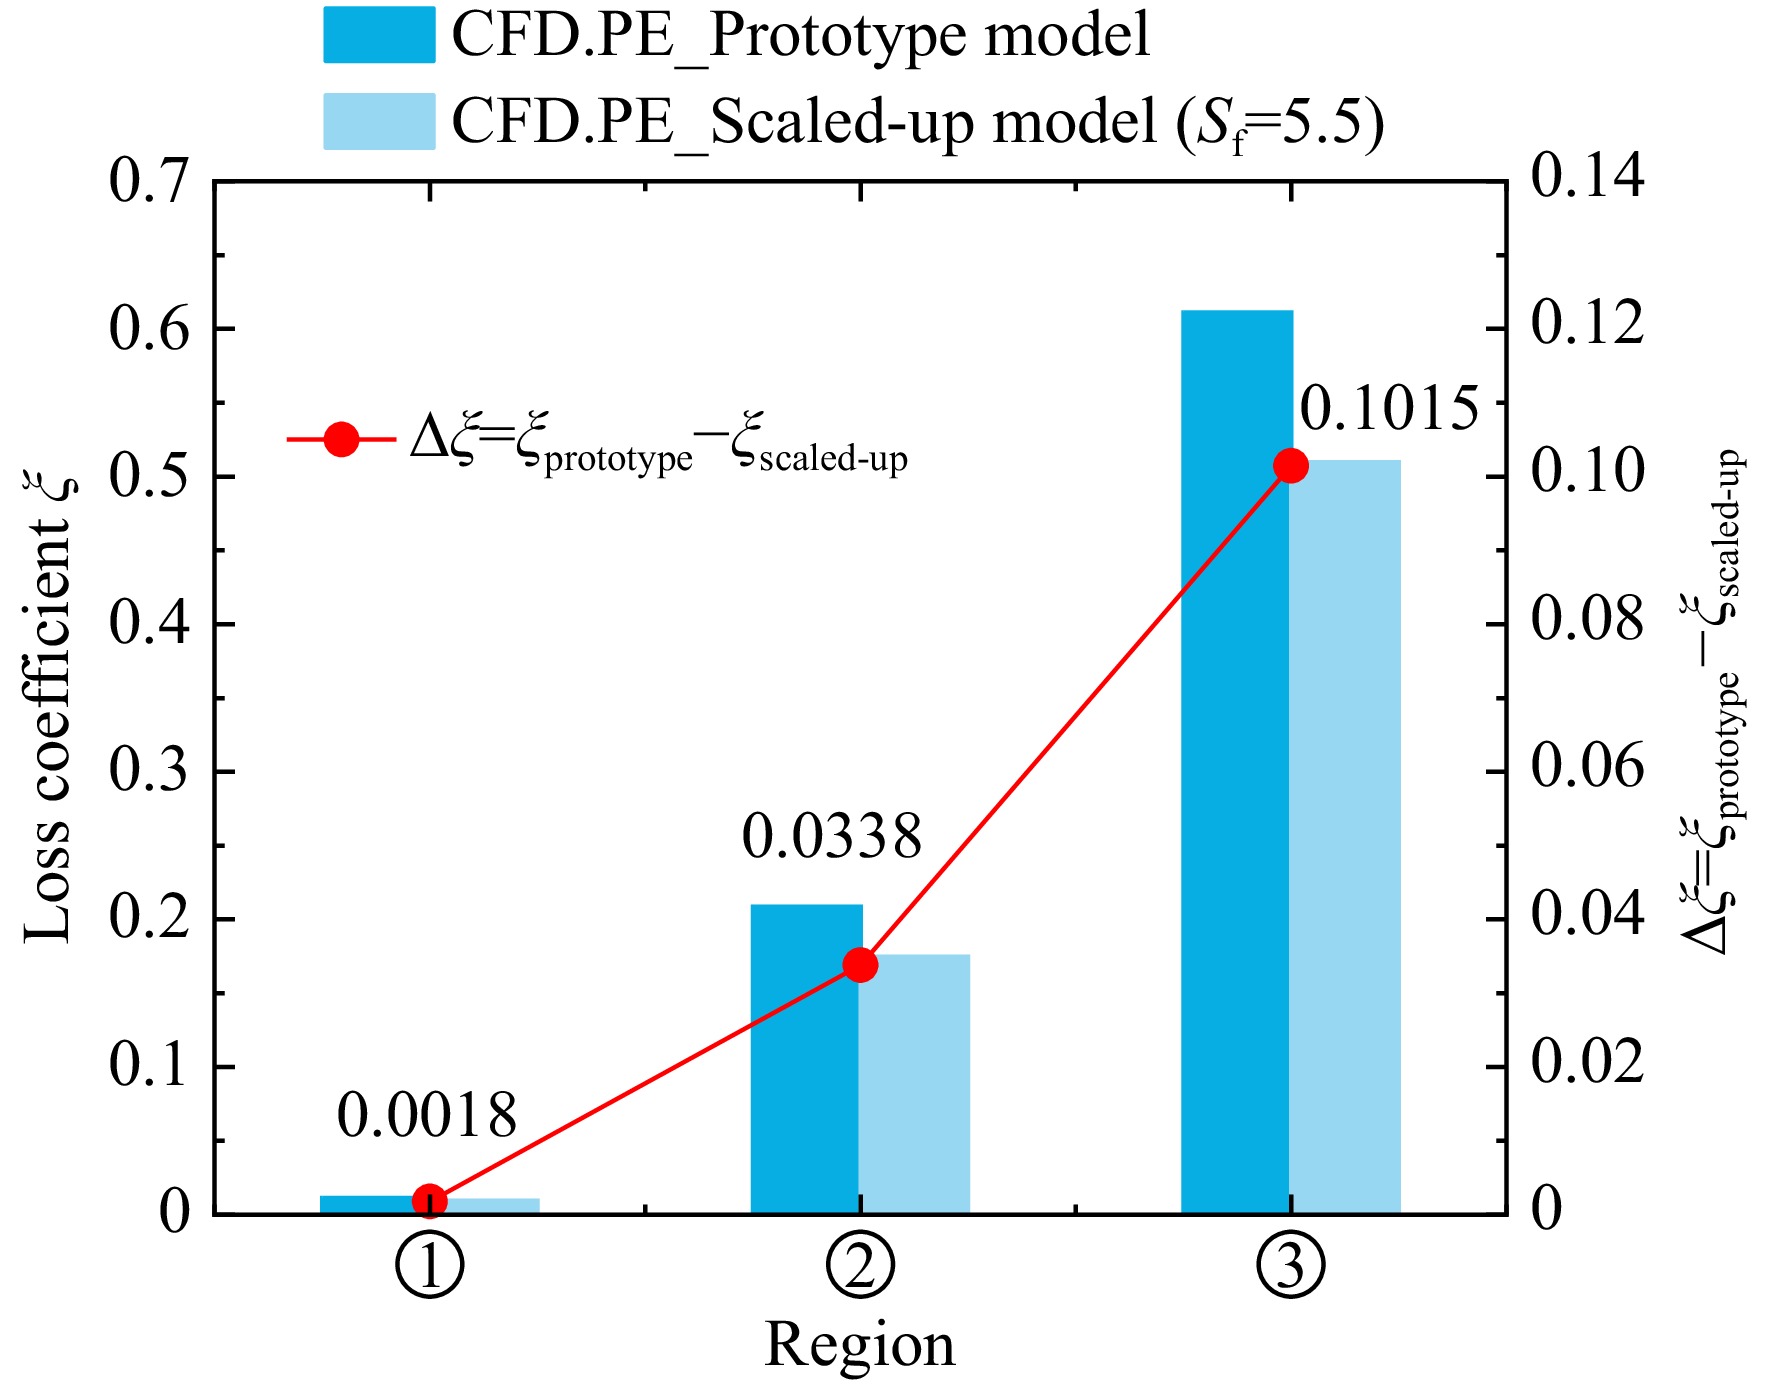
图 26 小/大模型叶中区域沿轴向损失分布
Figure 26. Comparison of loss streamwise distribution from 20% spanwise to 80% spanwise between the prototype and scaled-up model
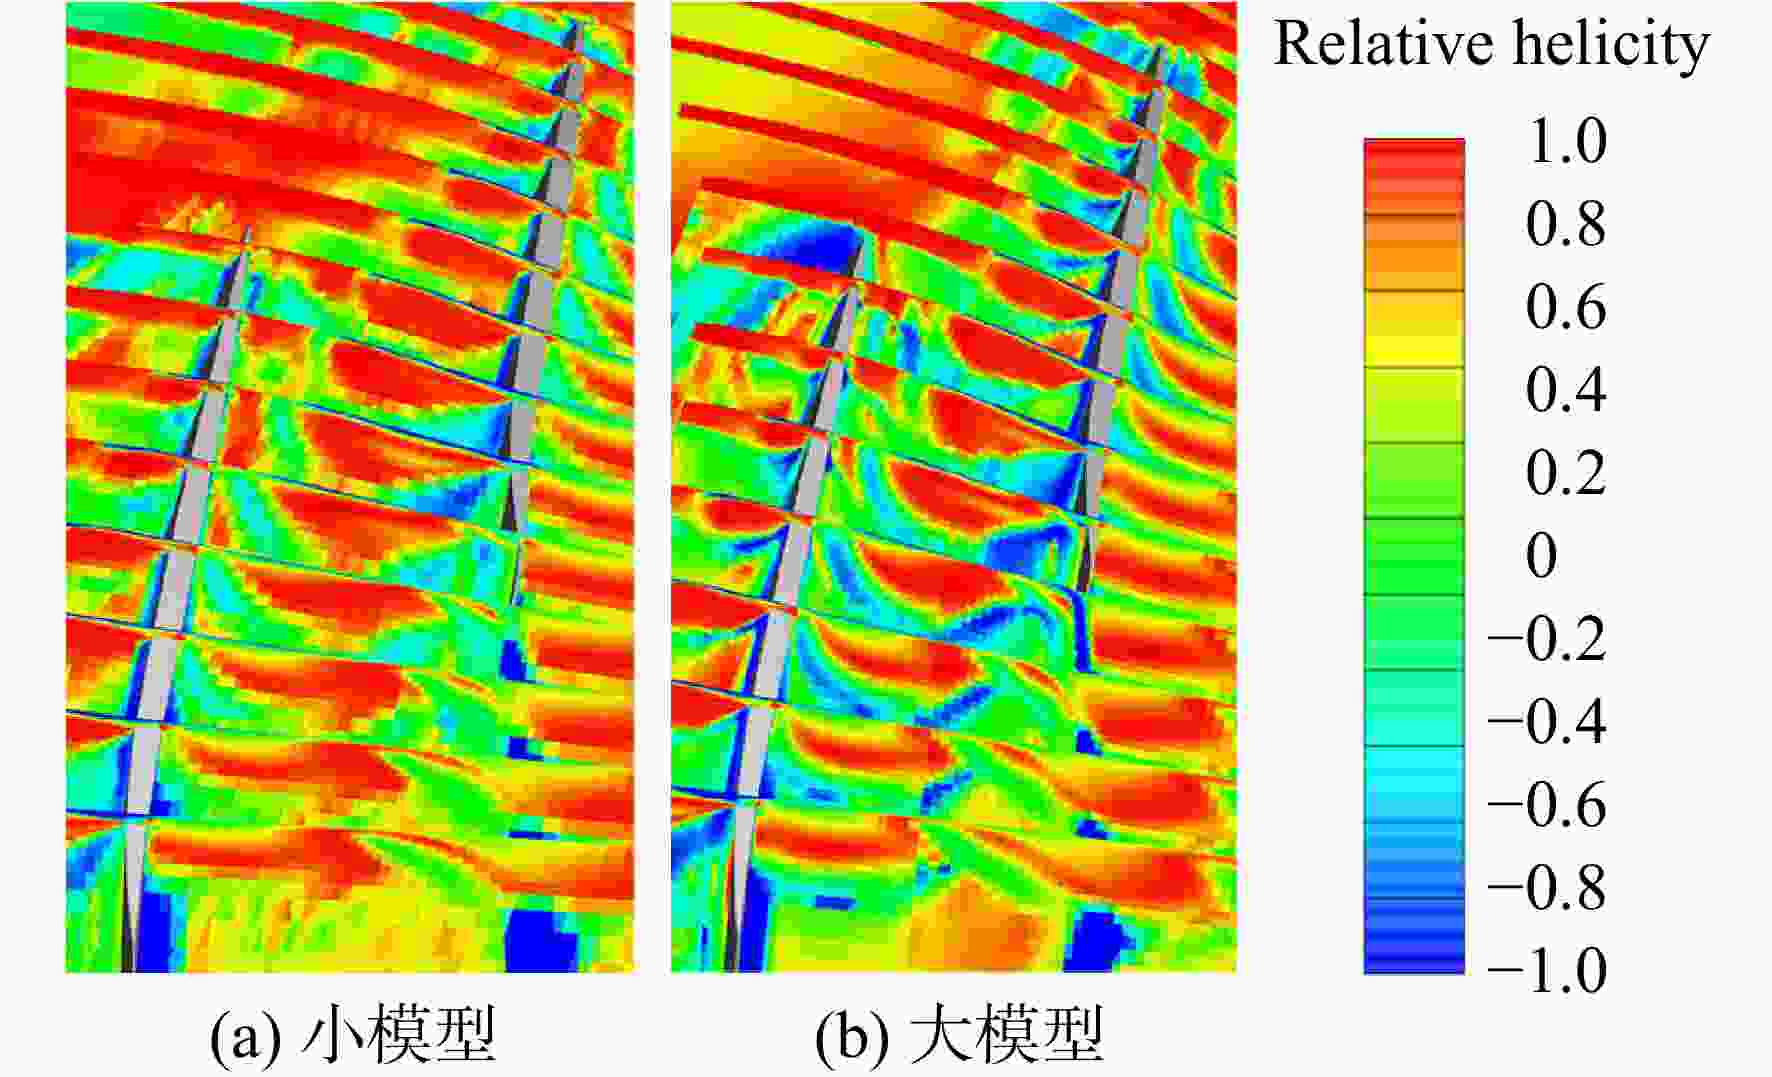
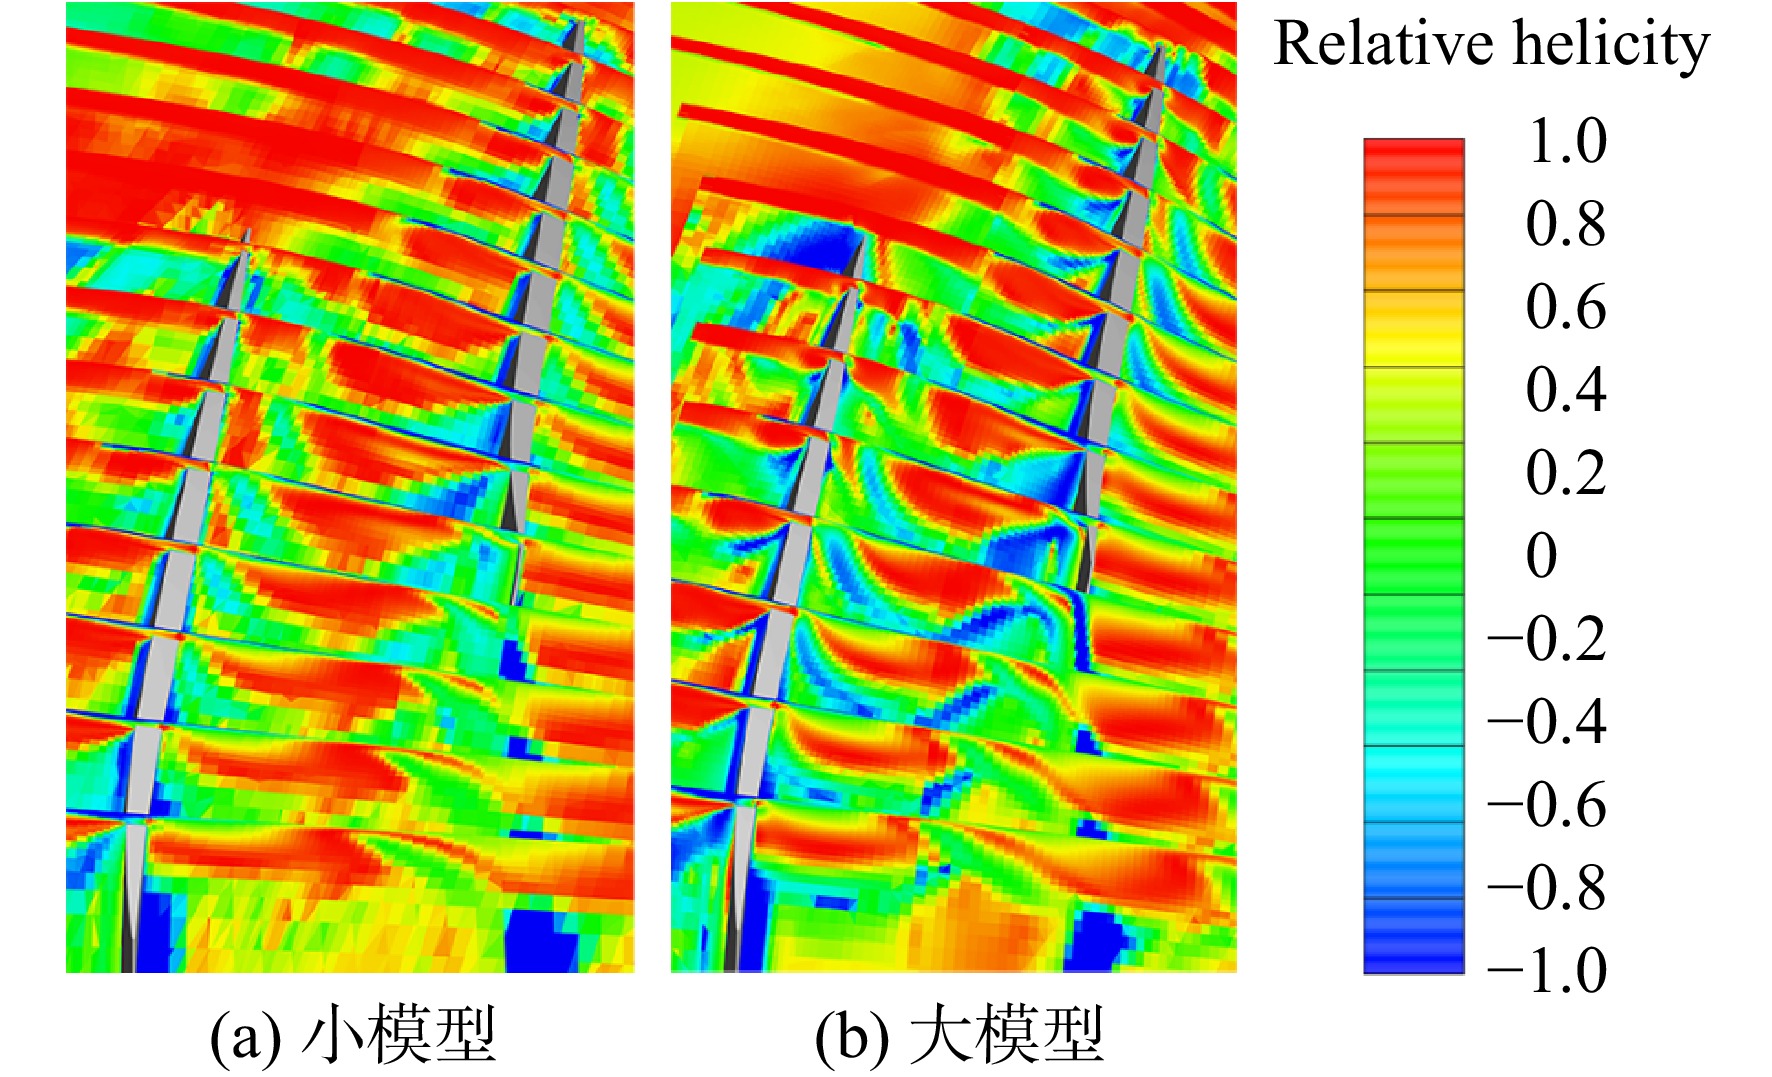
图 28 小/大模型螺旋度云图
Figure 28. Comparison of relative helicity contour between the prototype and scaled-up model
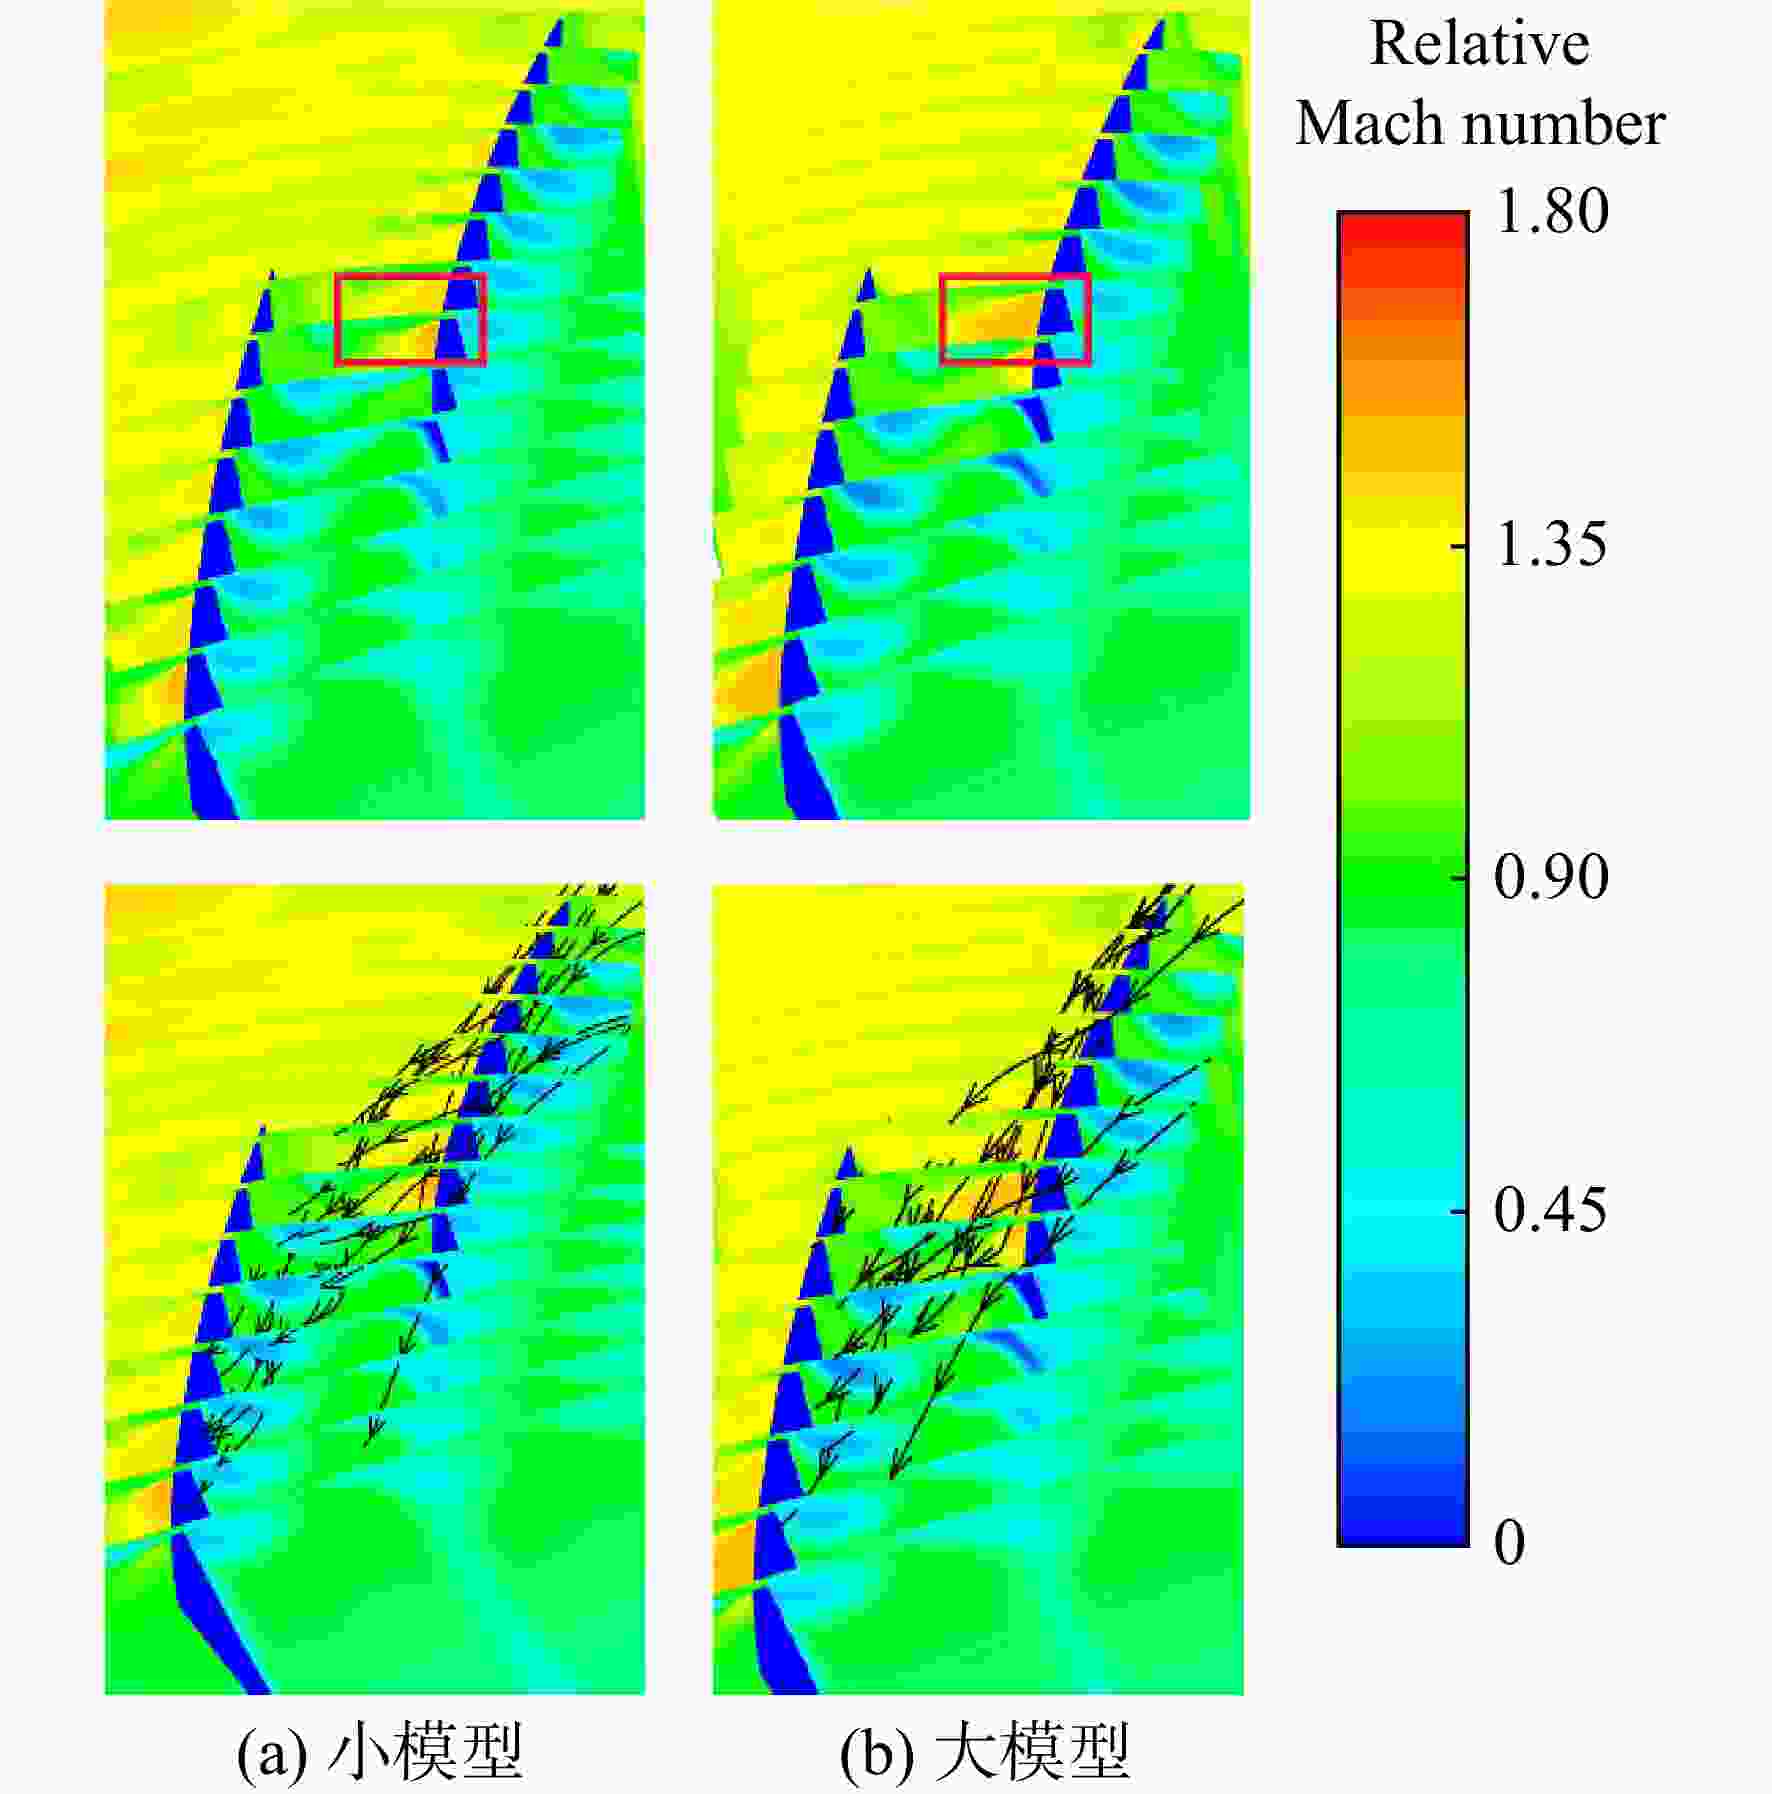
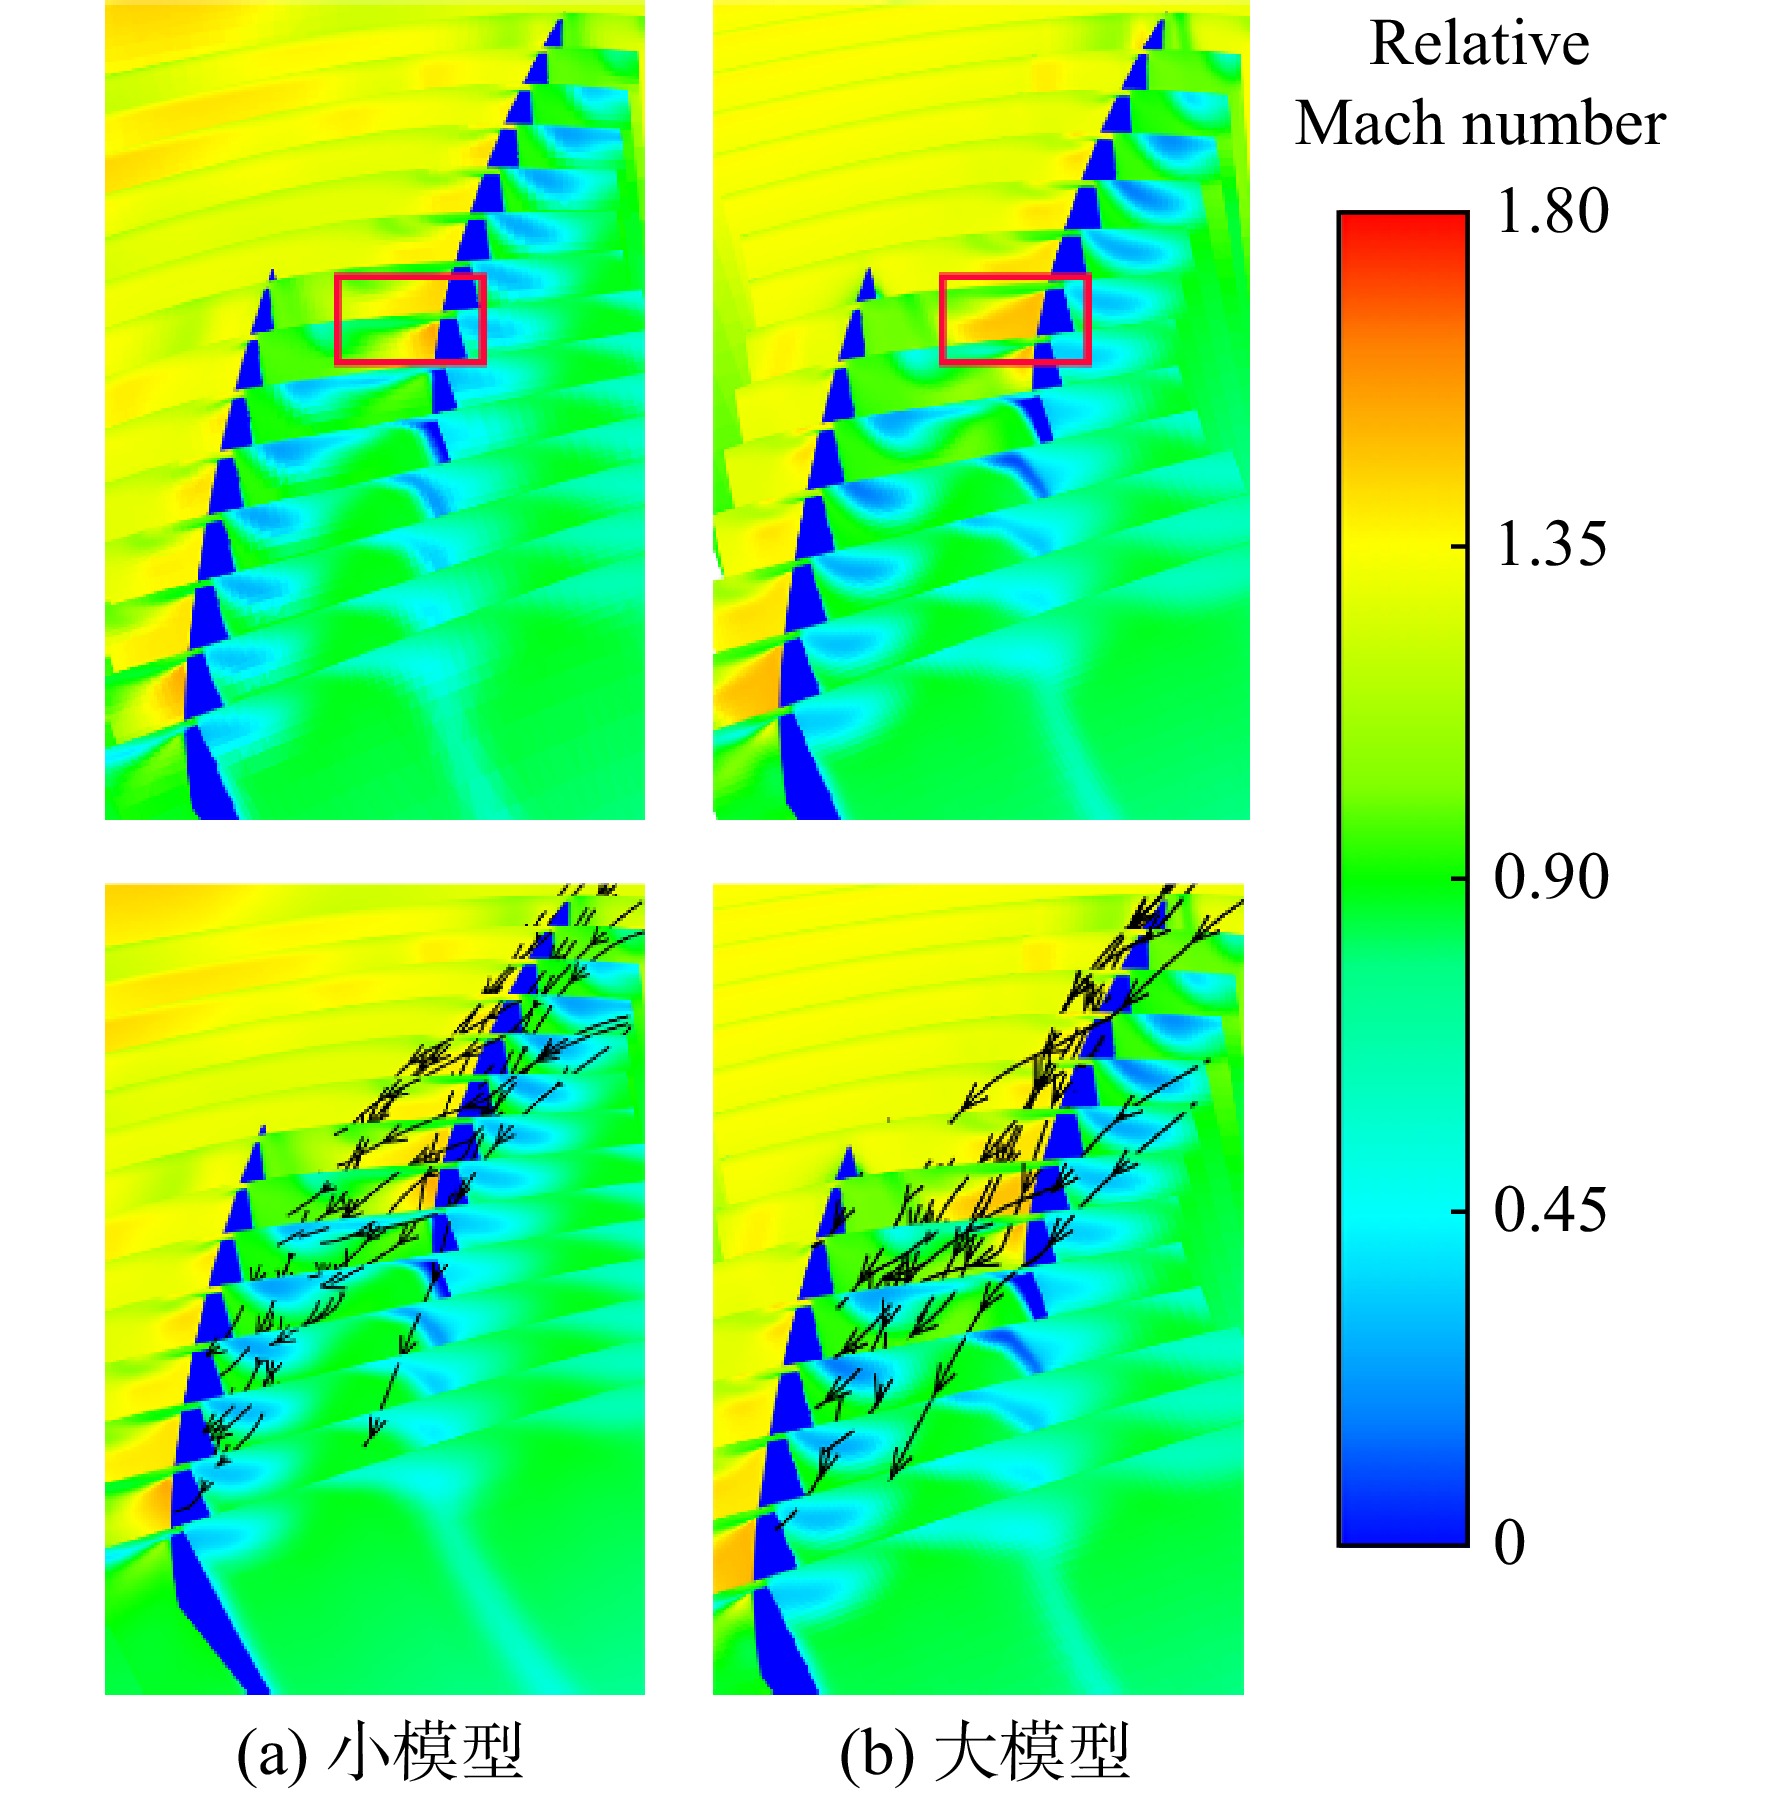
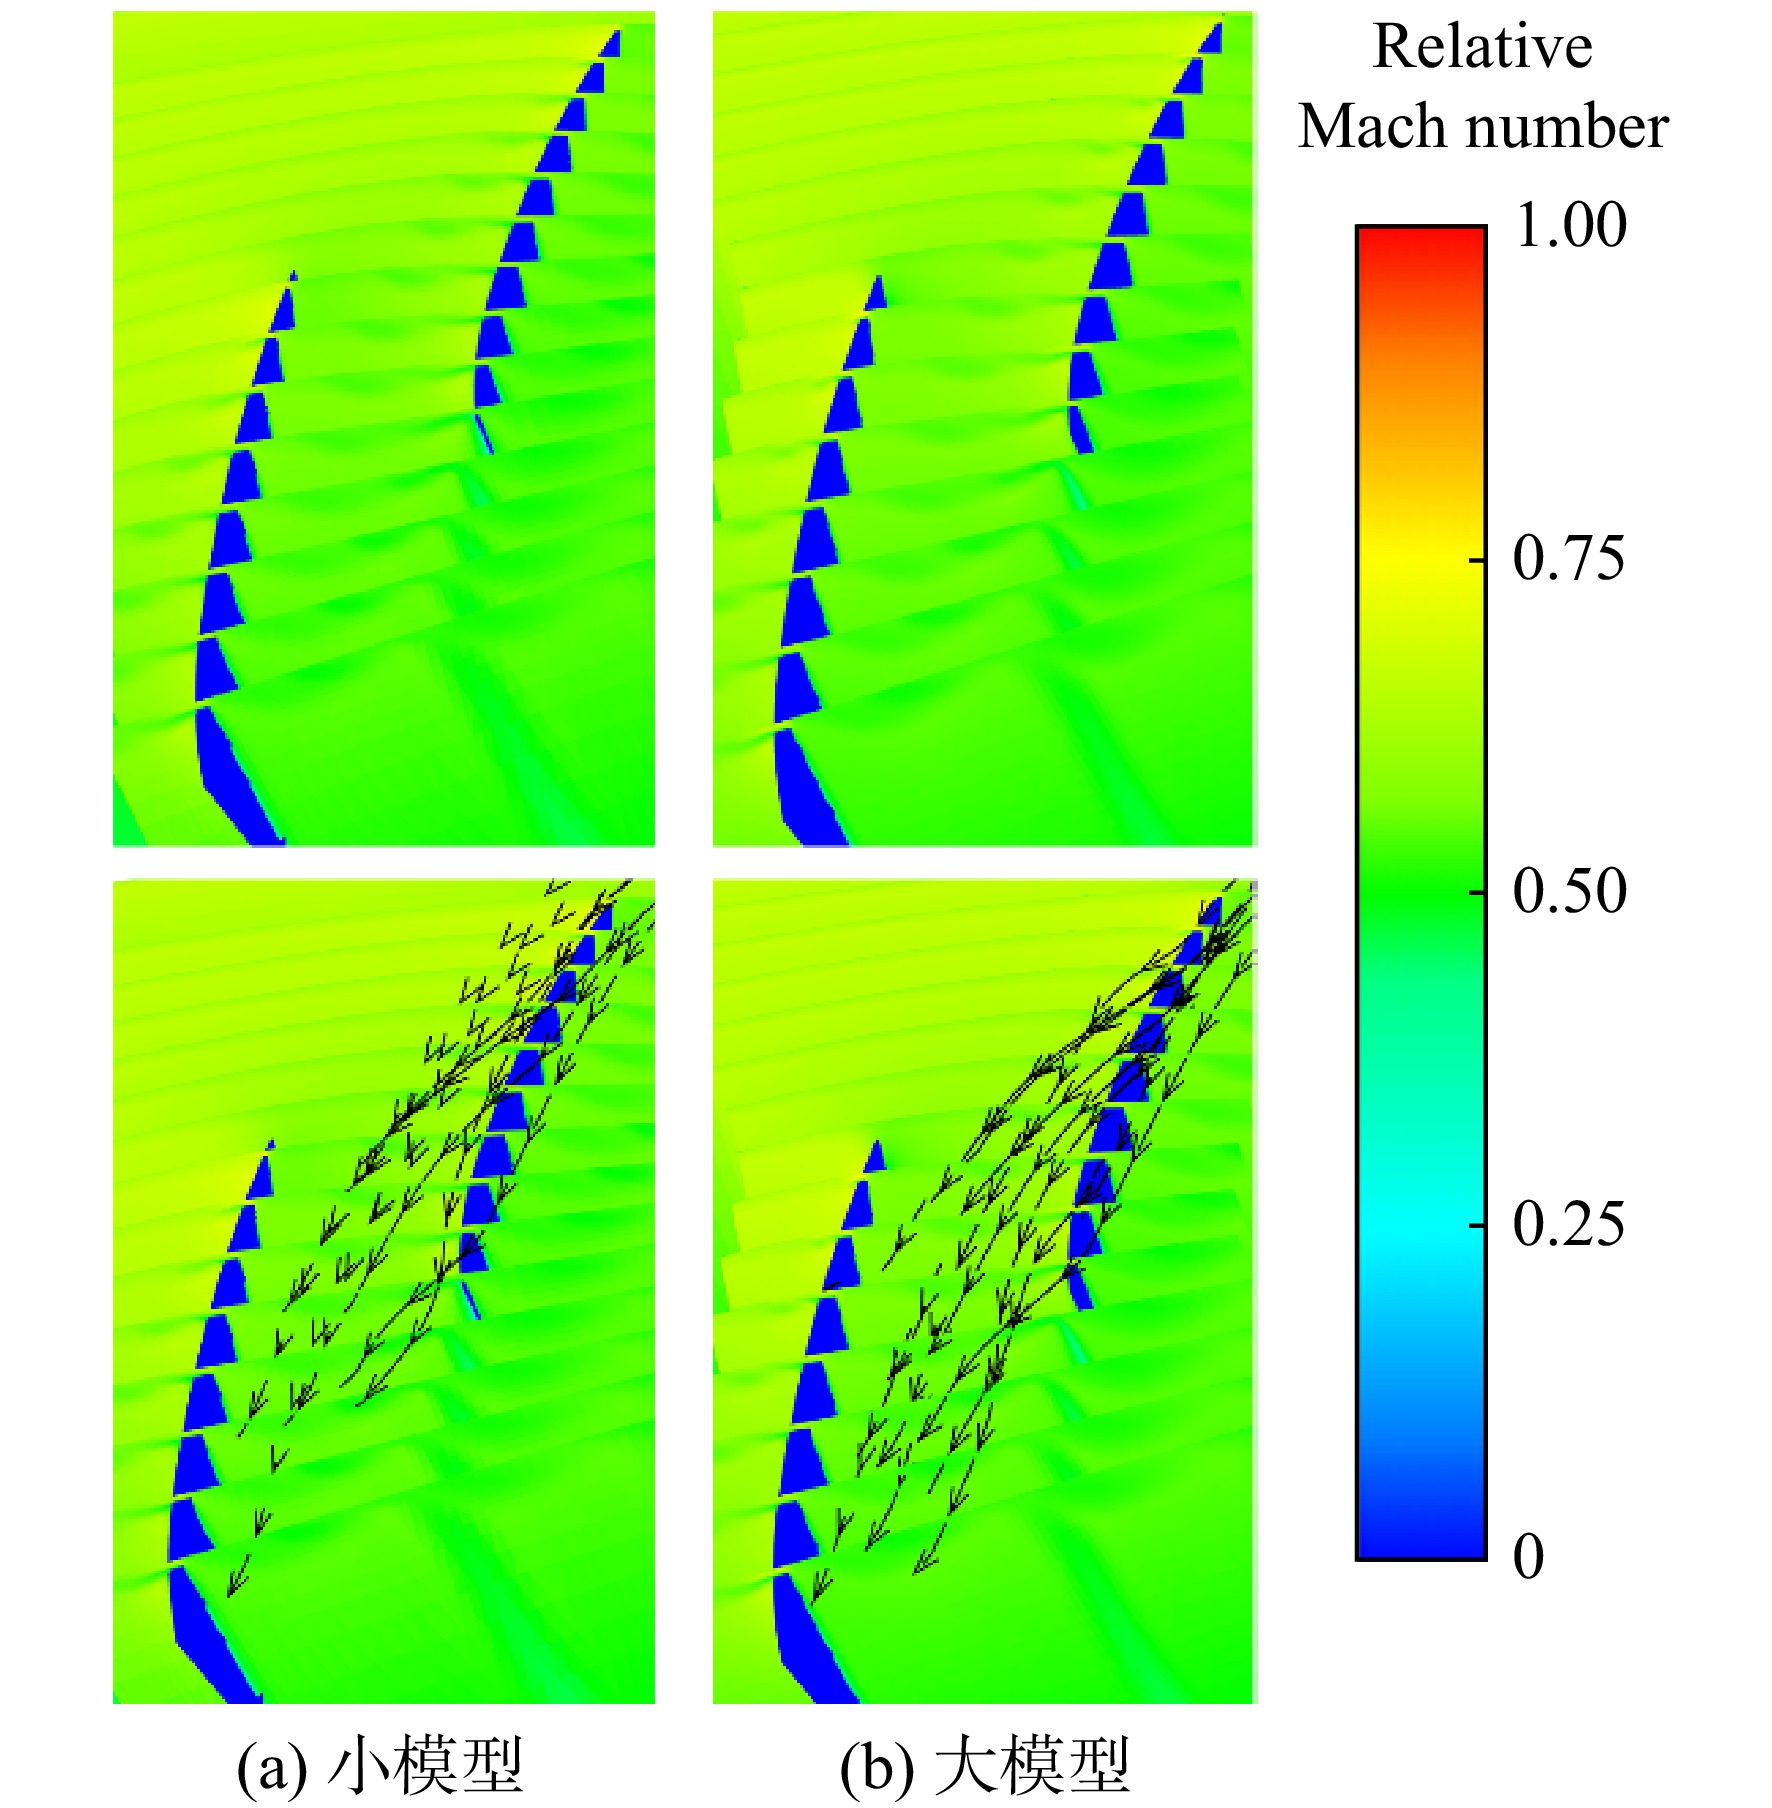
图 29 小/大模型速度流线和相对马赫数云图
Figure 29. Comparison of velocity streamlines and relative Mach number between the prototype and scaled-up model
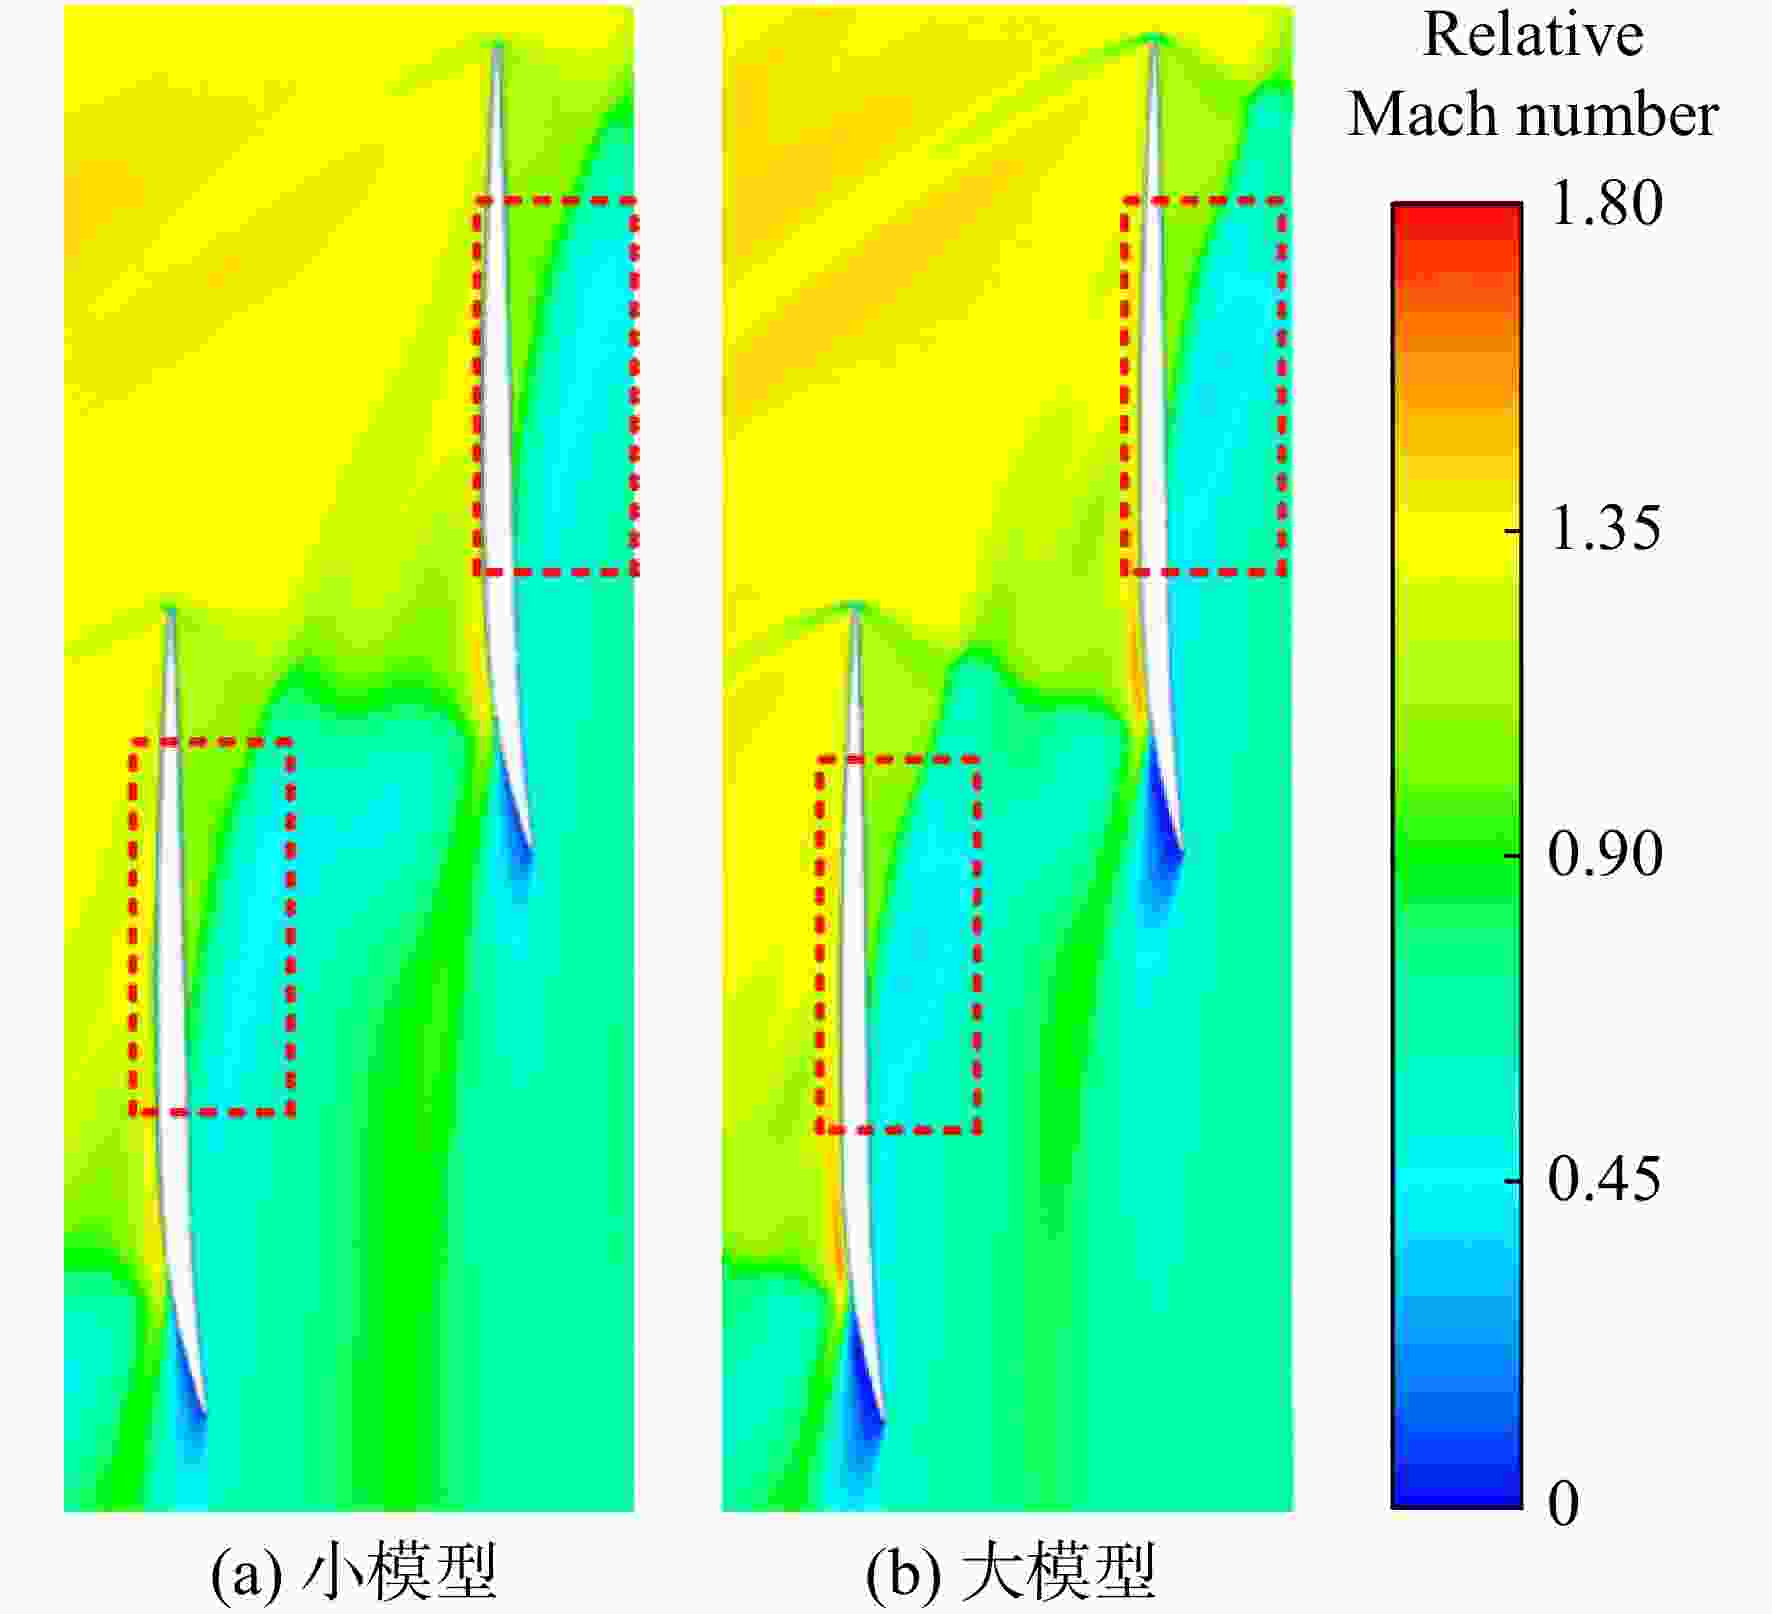
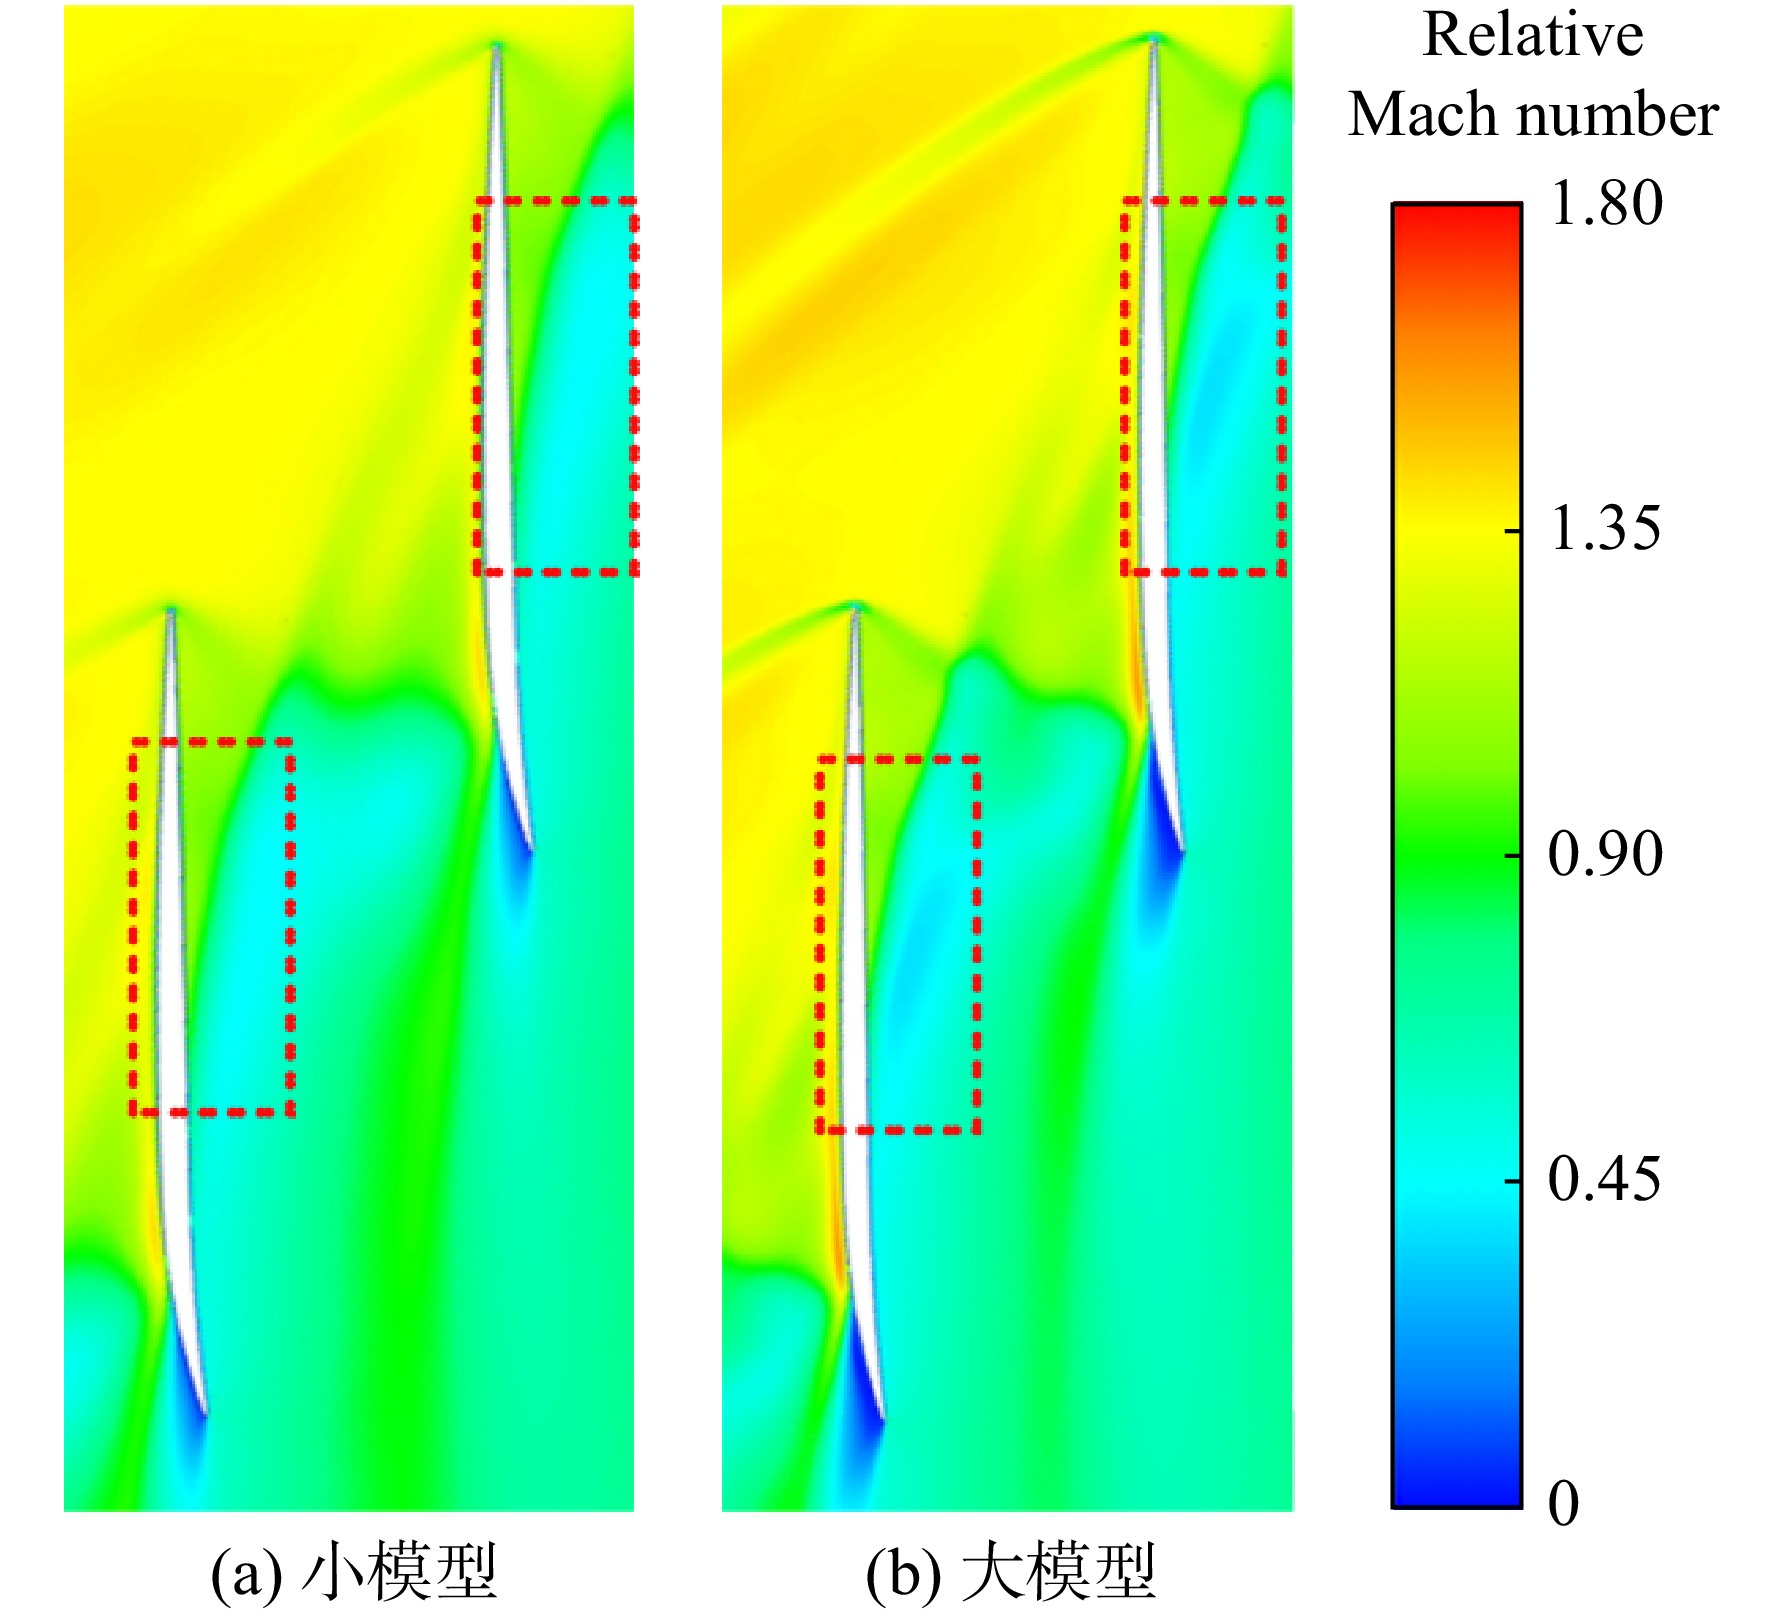
图 30 小/大模型99%叶高相对马赫数云图
Figure 30. Comparison of 99% spanwise relative Mach number between the prototype and scaled-up model
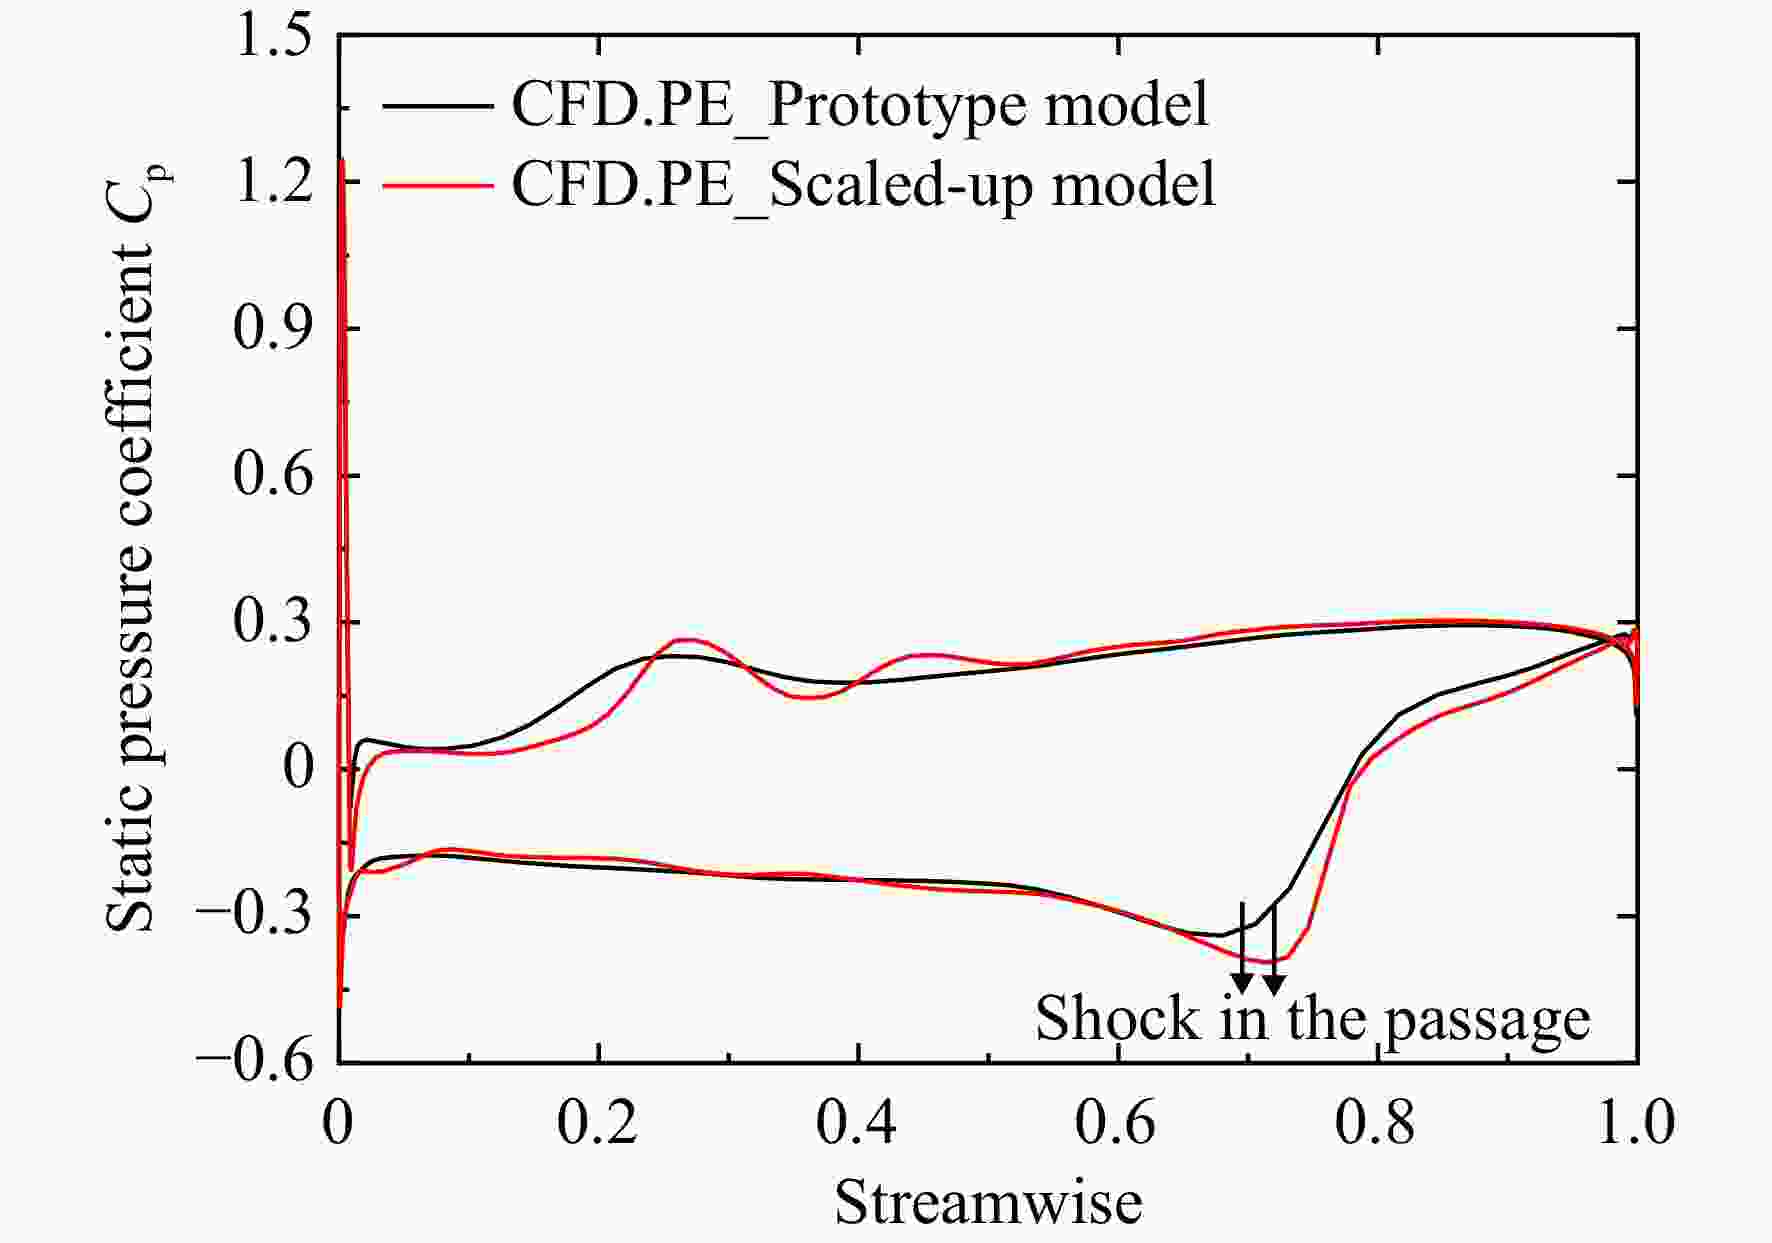
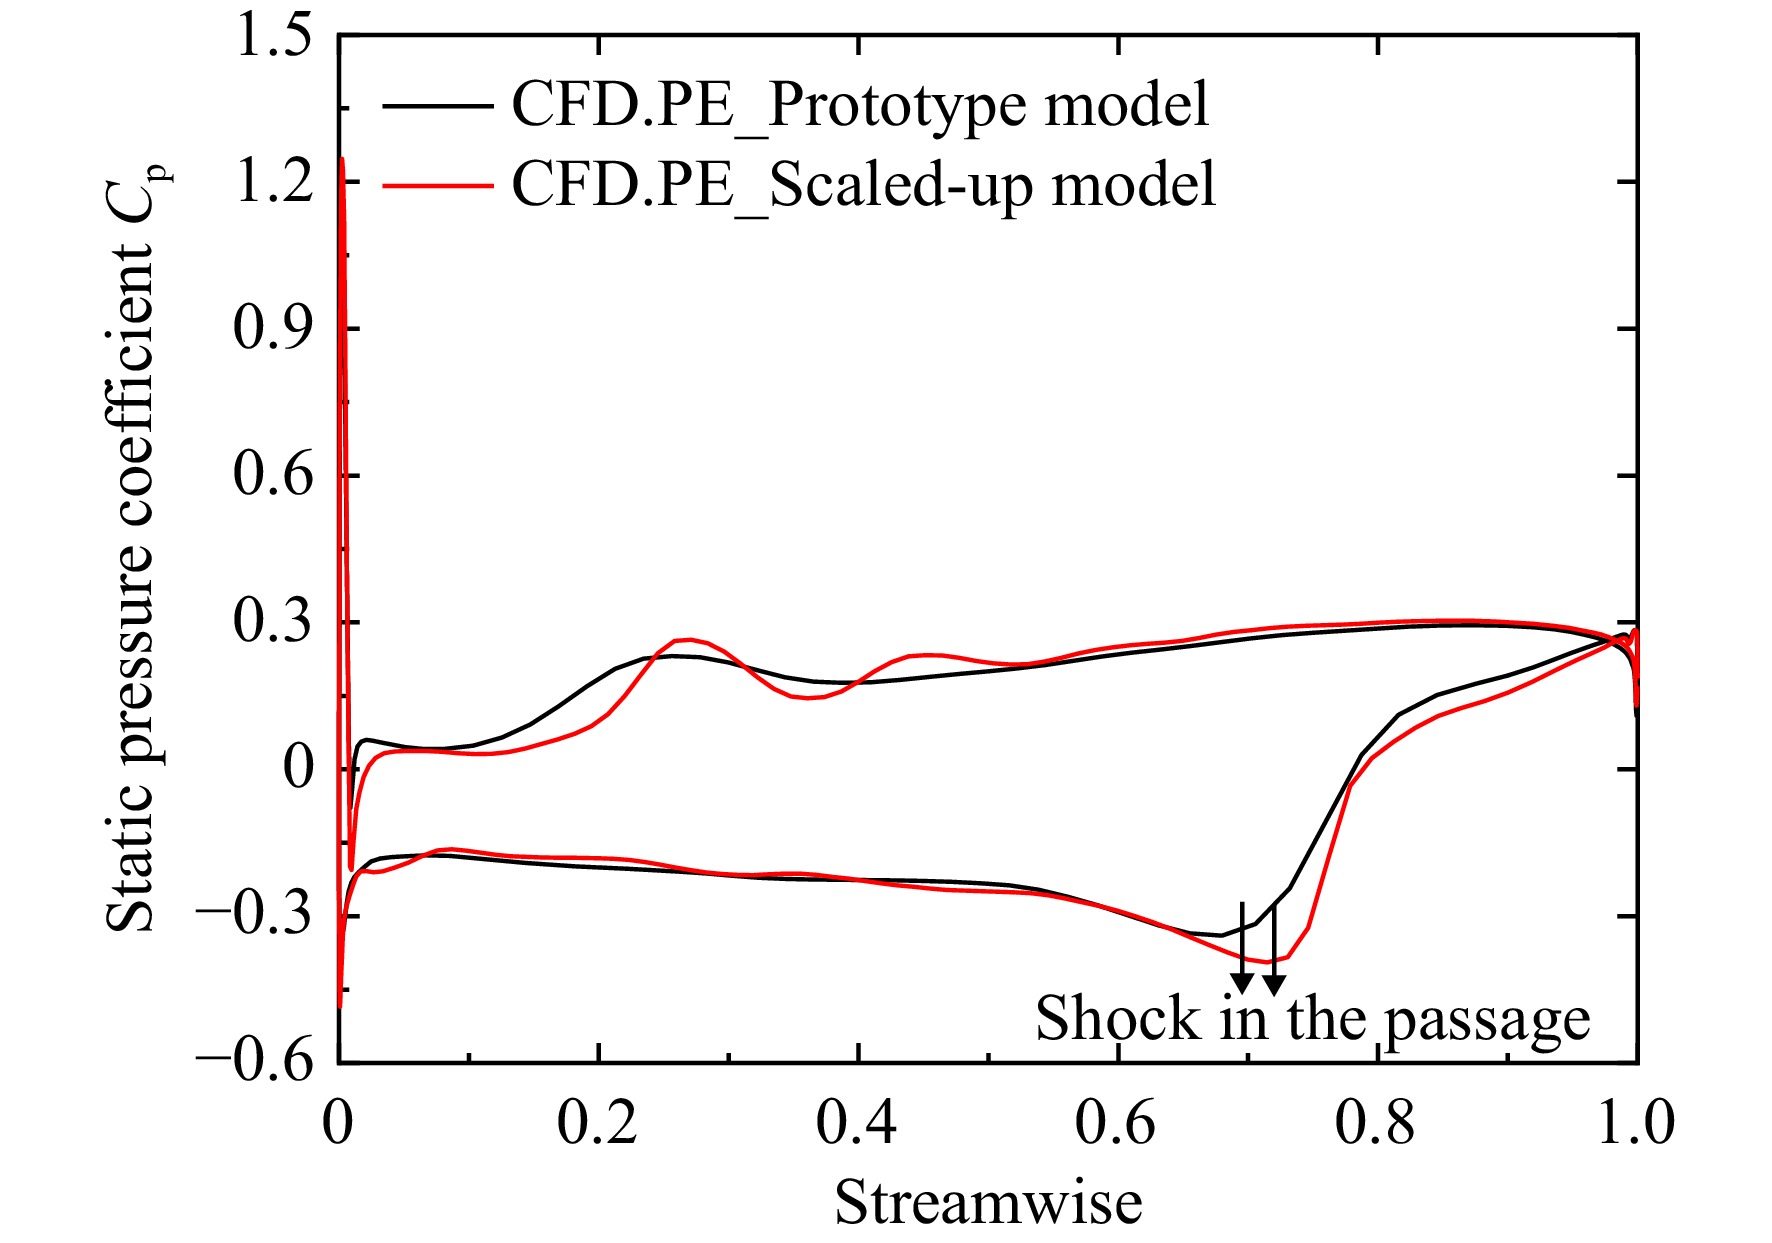
图 31 小/大模型95%叶高静压系数云图
Figure 31. Comparison of 95% spanwise static pressure coefficient between the prototype and scaled-up model
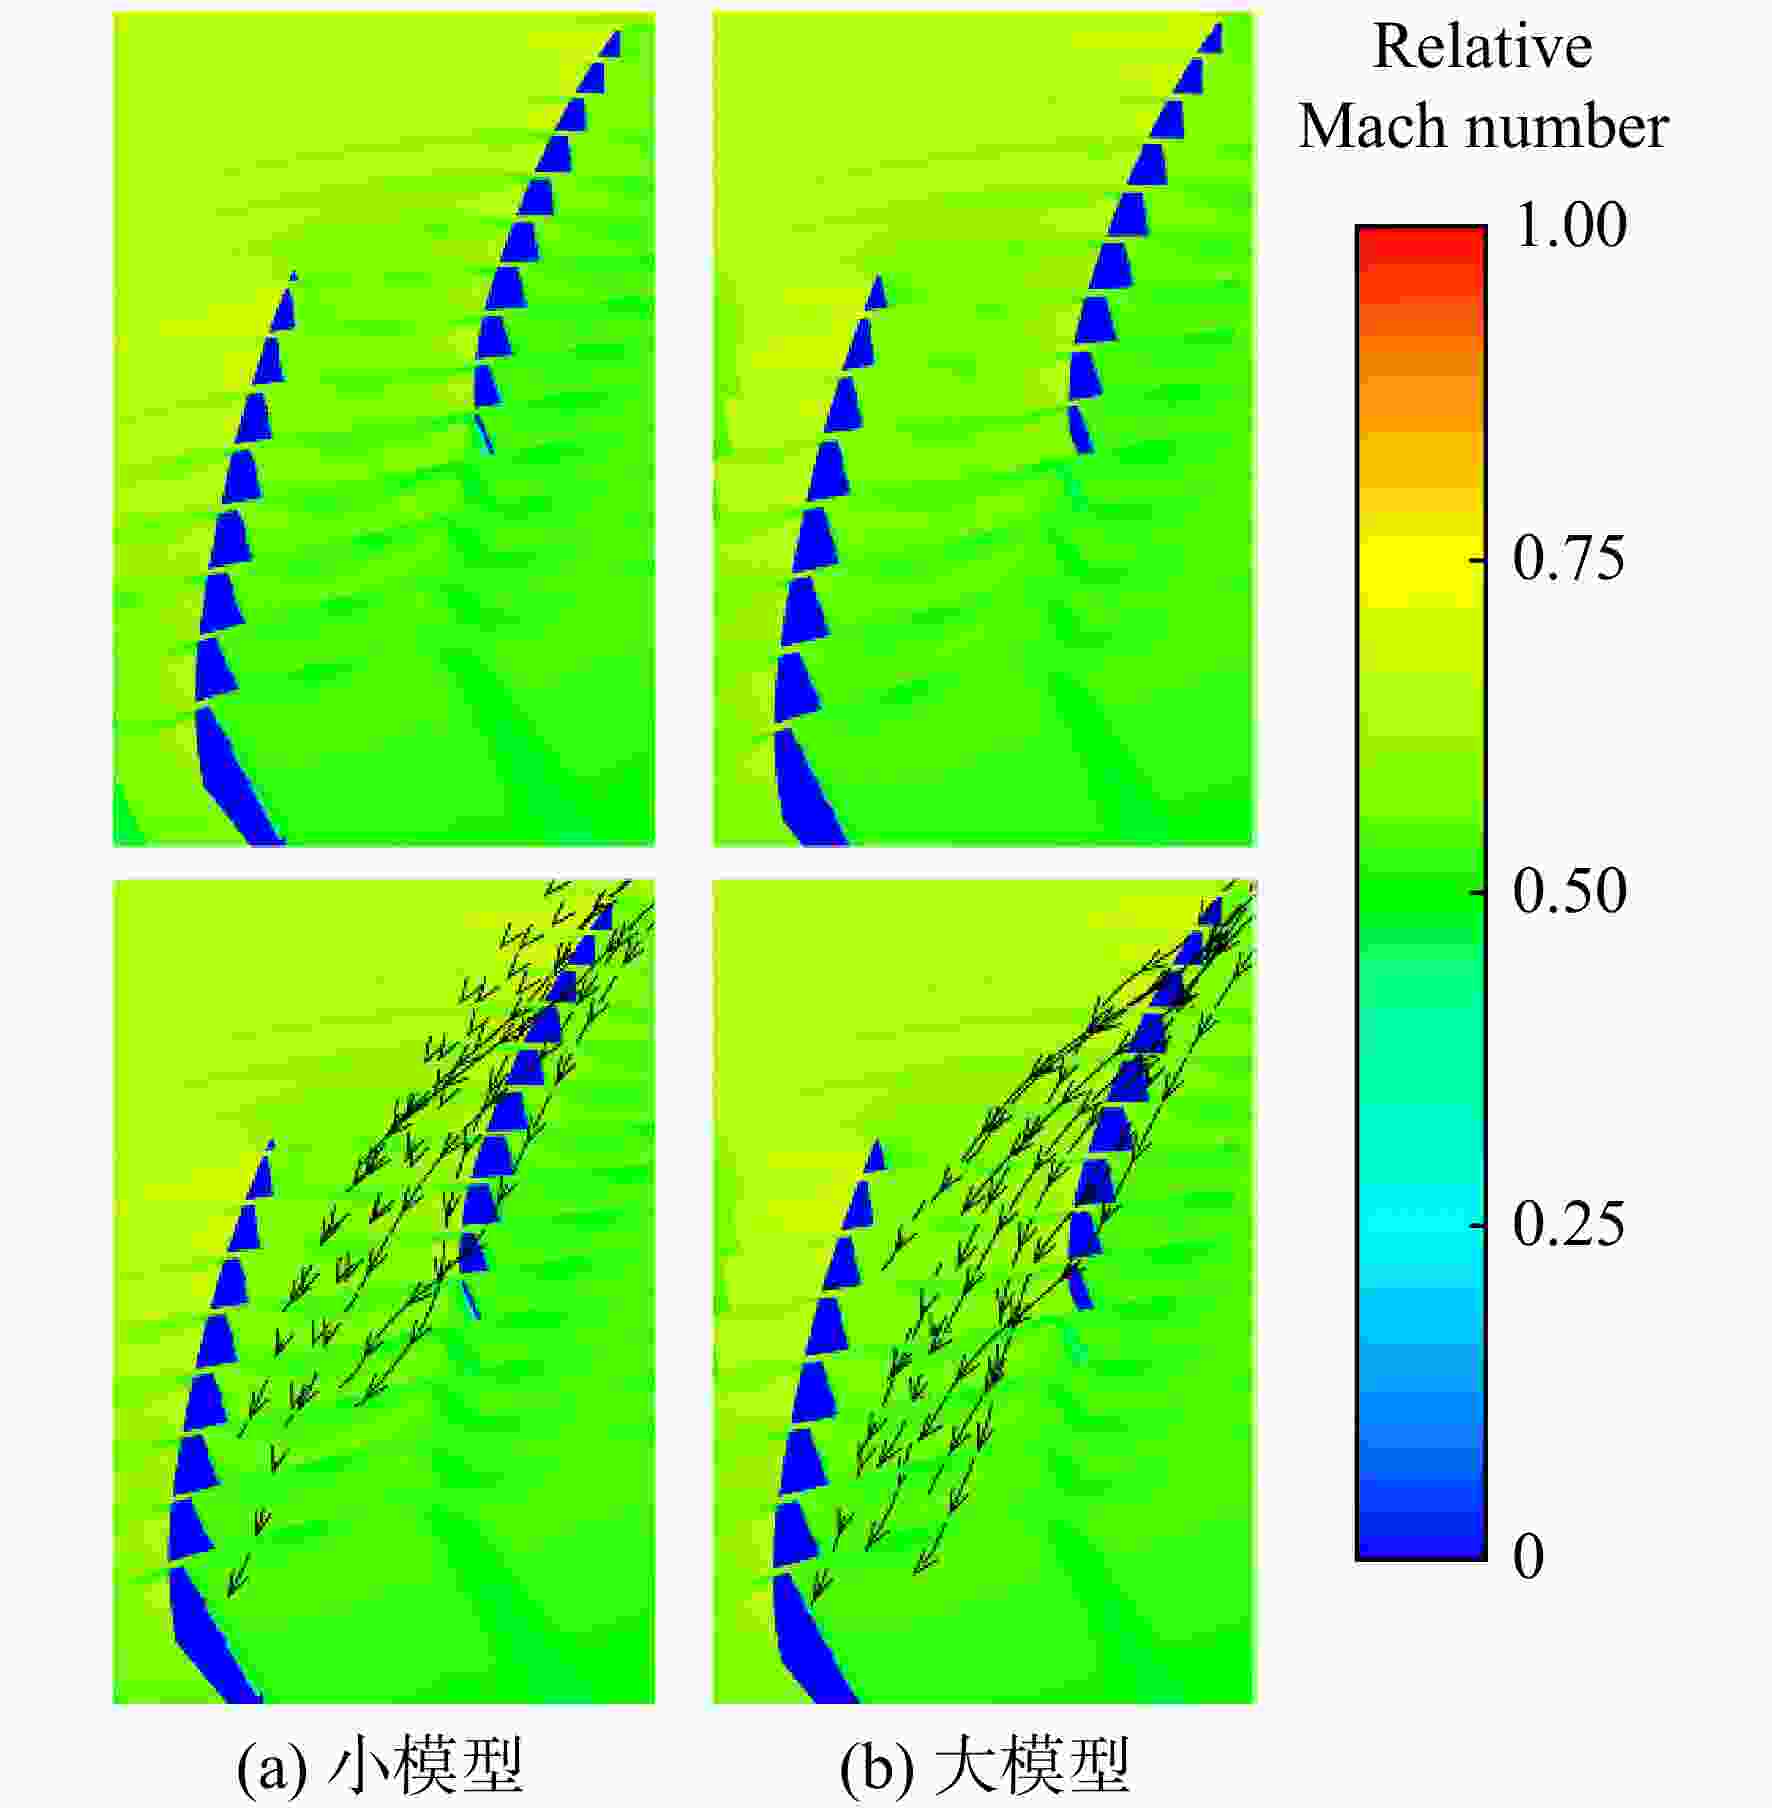
图 32 小/大模型亚声速速度流线和相对马赫数云图
Figure 32. Comparison of velocity streamlines and relative Mach number at subsonic between the prototype and scaled-up model
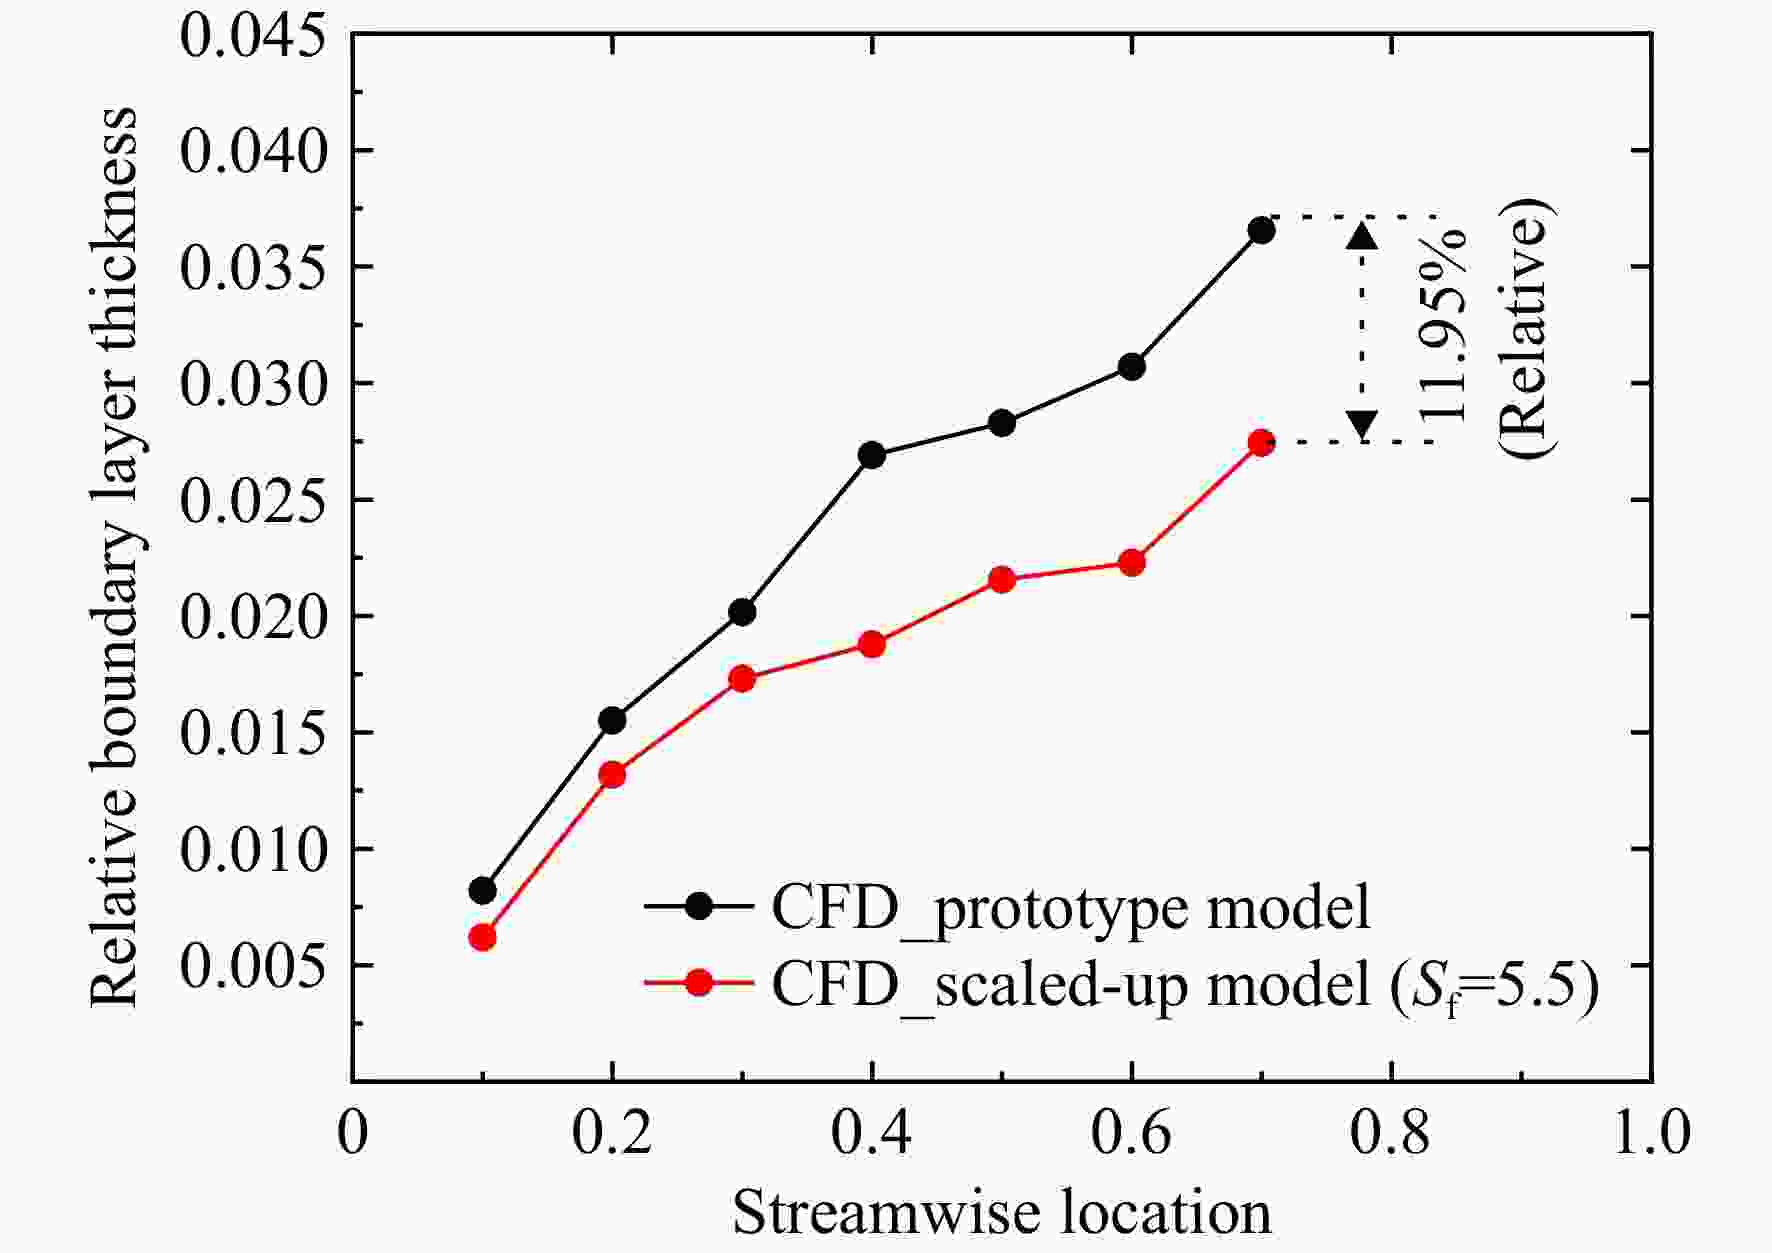
图 33 小/大模型95%叶高相对边界层厚度
Figure 33. Comparison of 95% spanwise relative boundary layer thickness between the prototype and scaled-up model
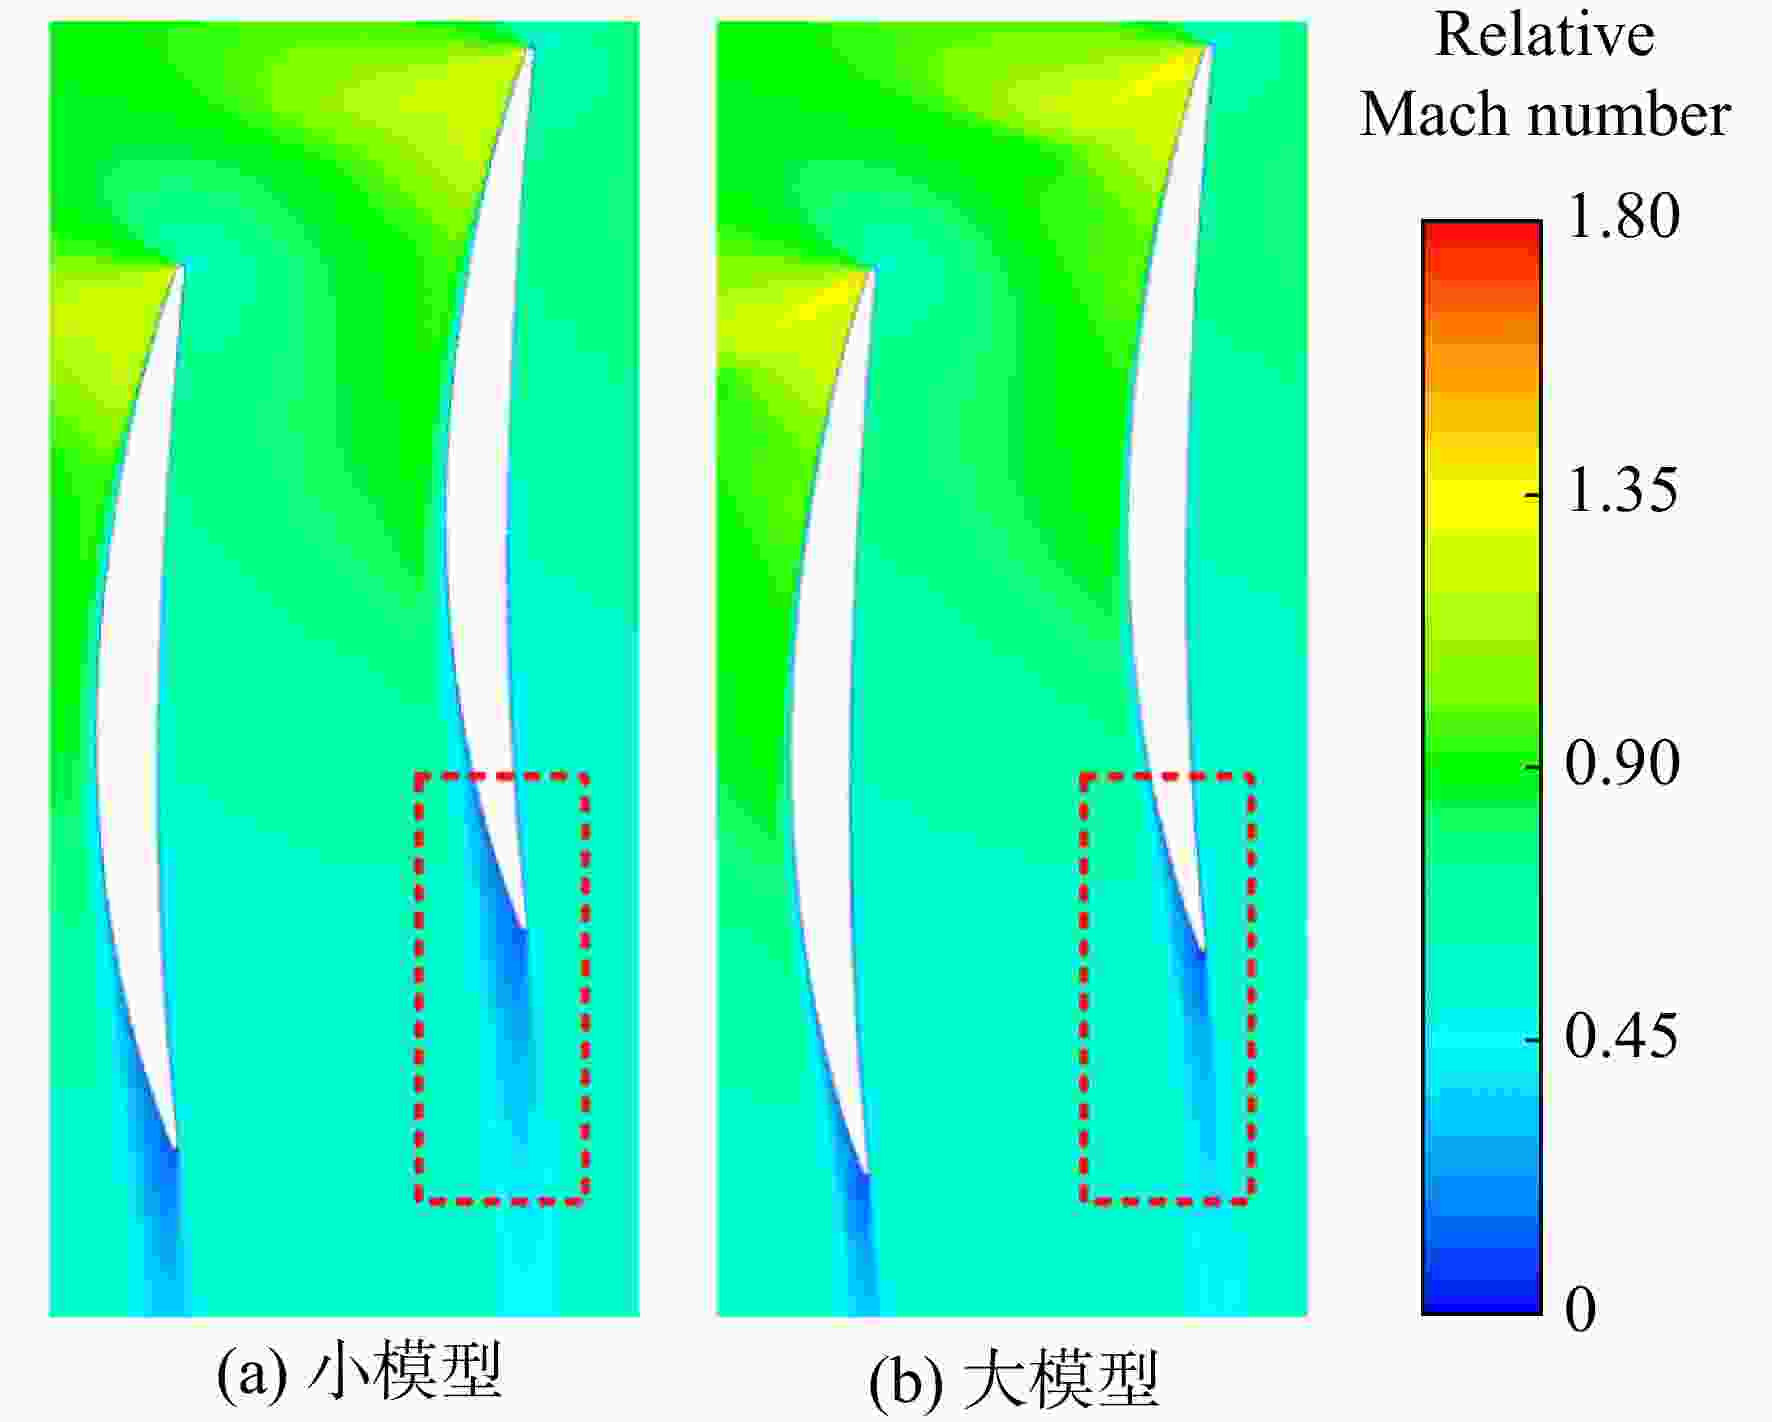
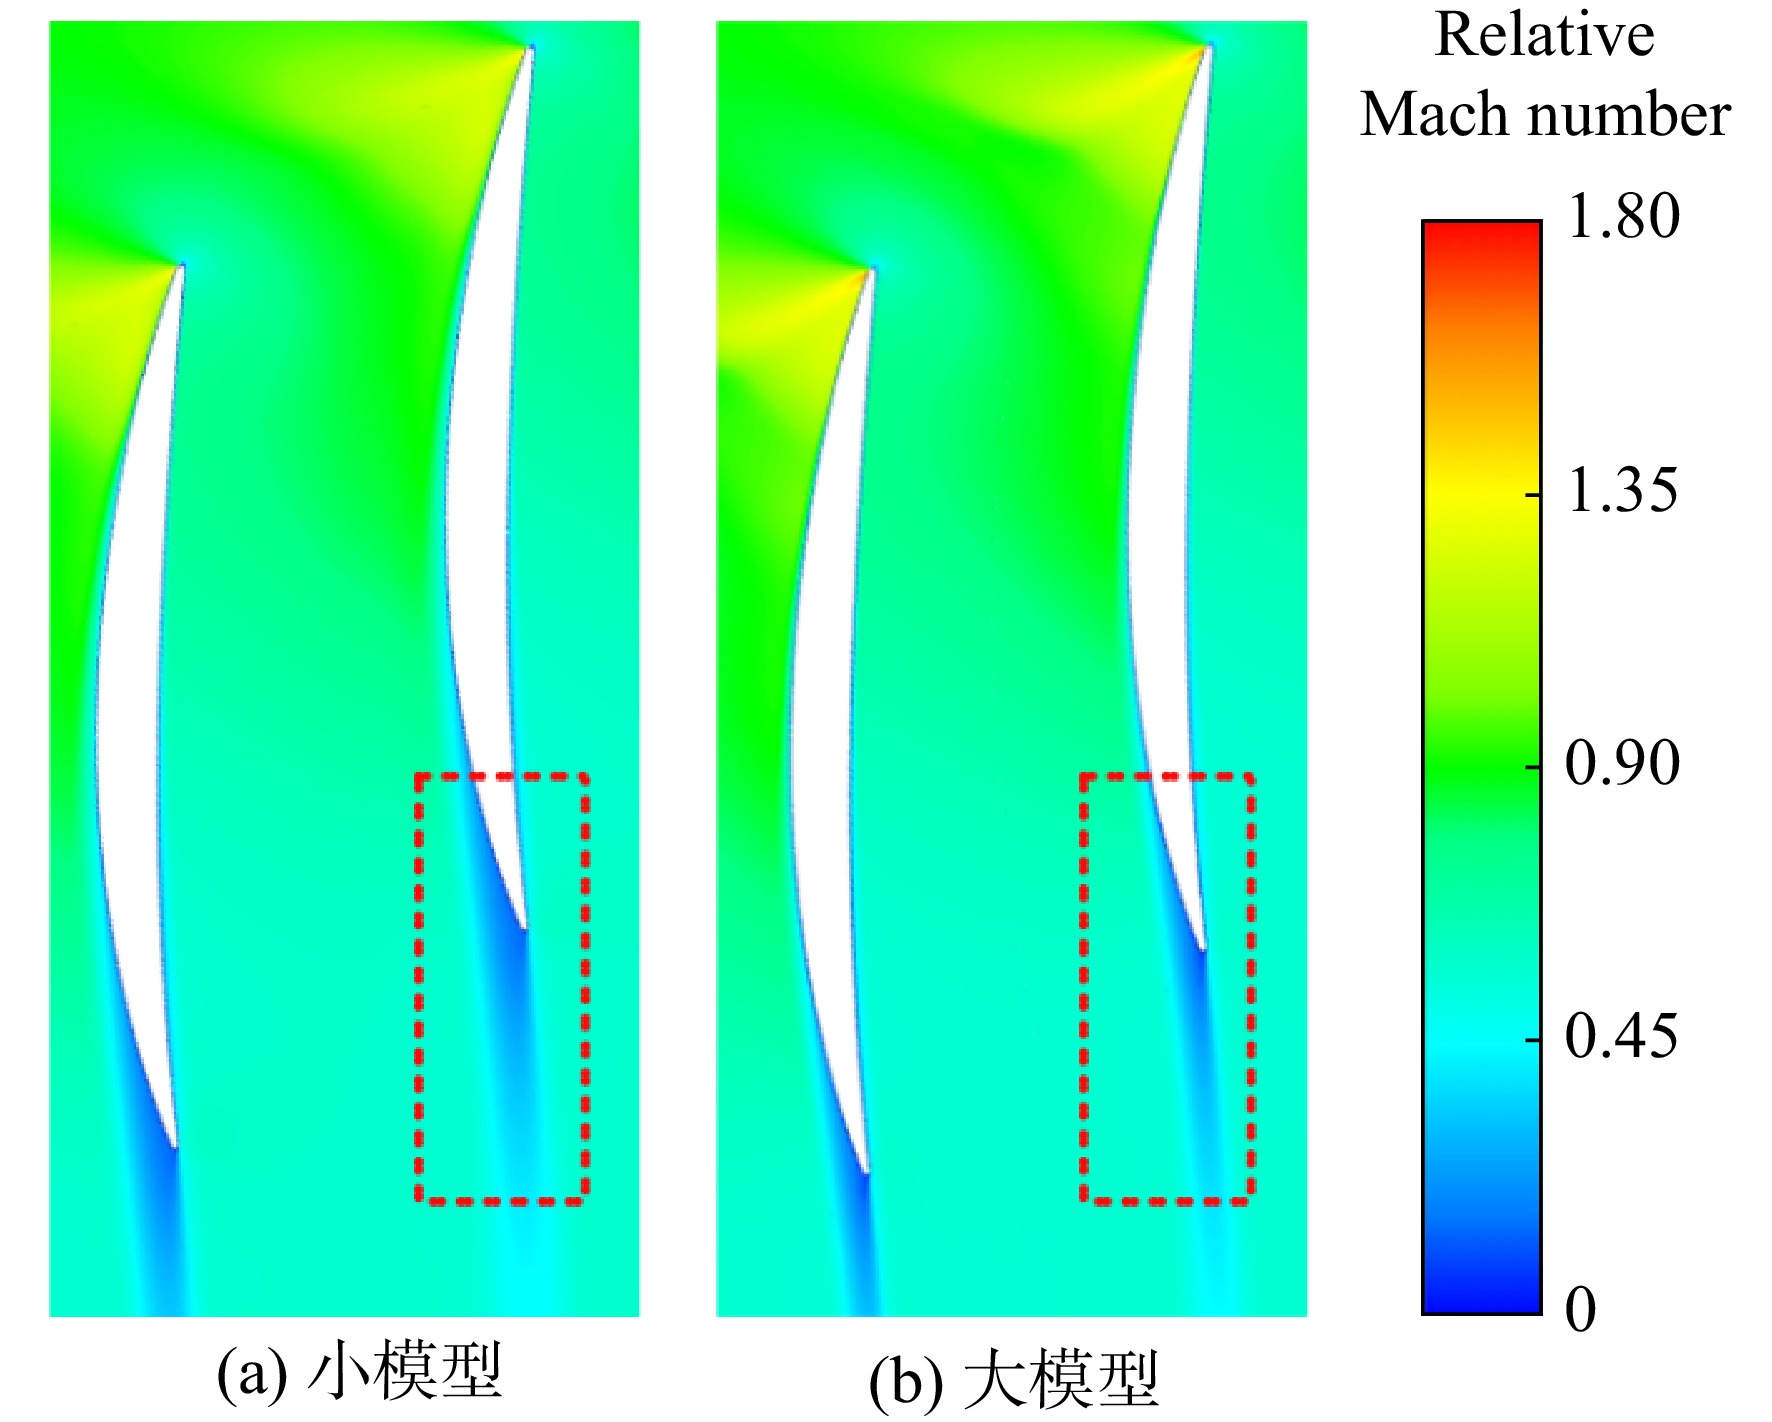
图 34 小模型/大模型30%叶高相对马赫数云图
Figure 34. Comparison of 30% spanwise relative Mach number contour between the prototype and scaled-up model
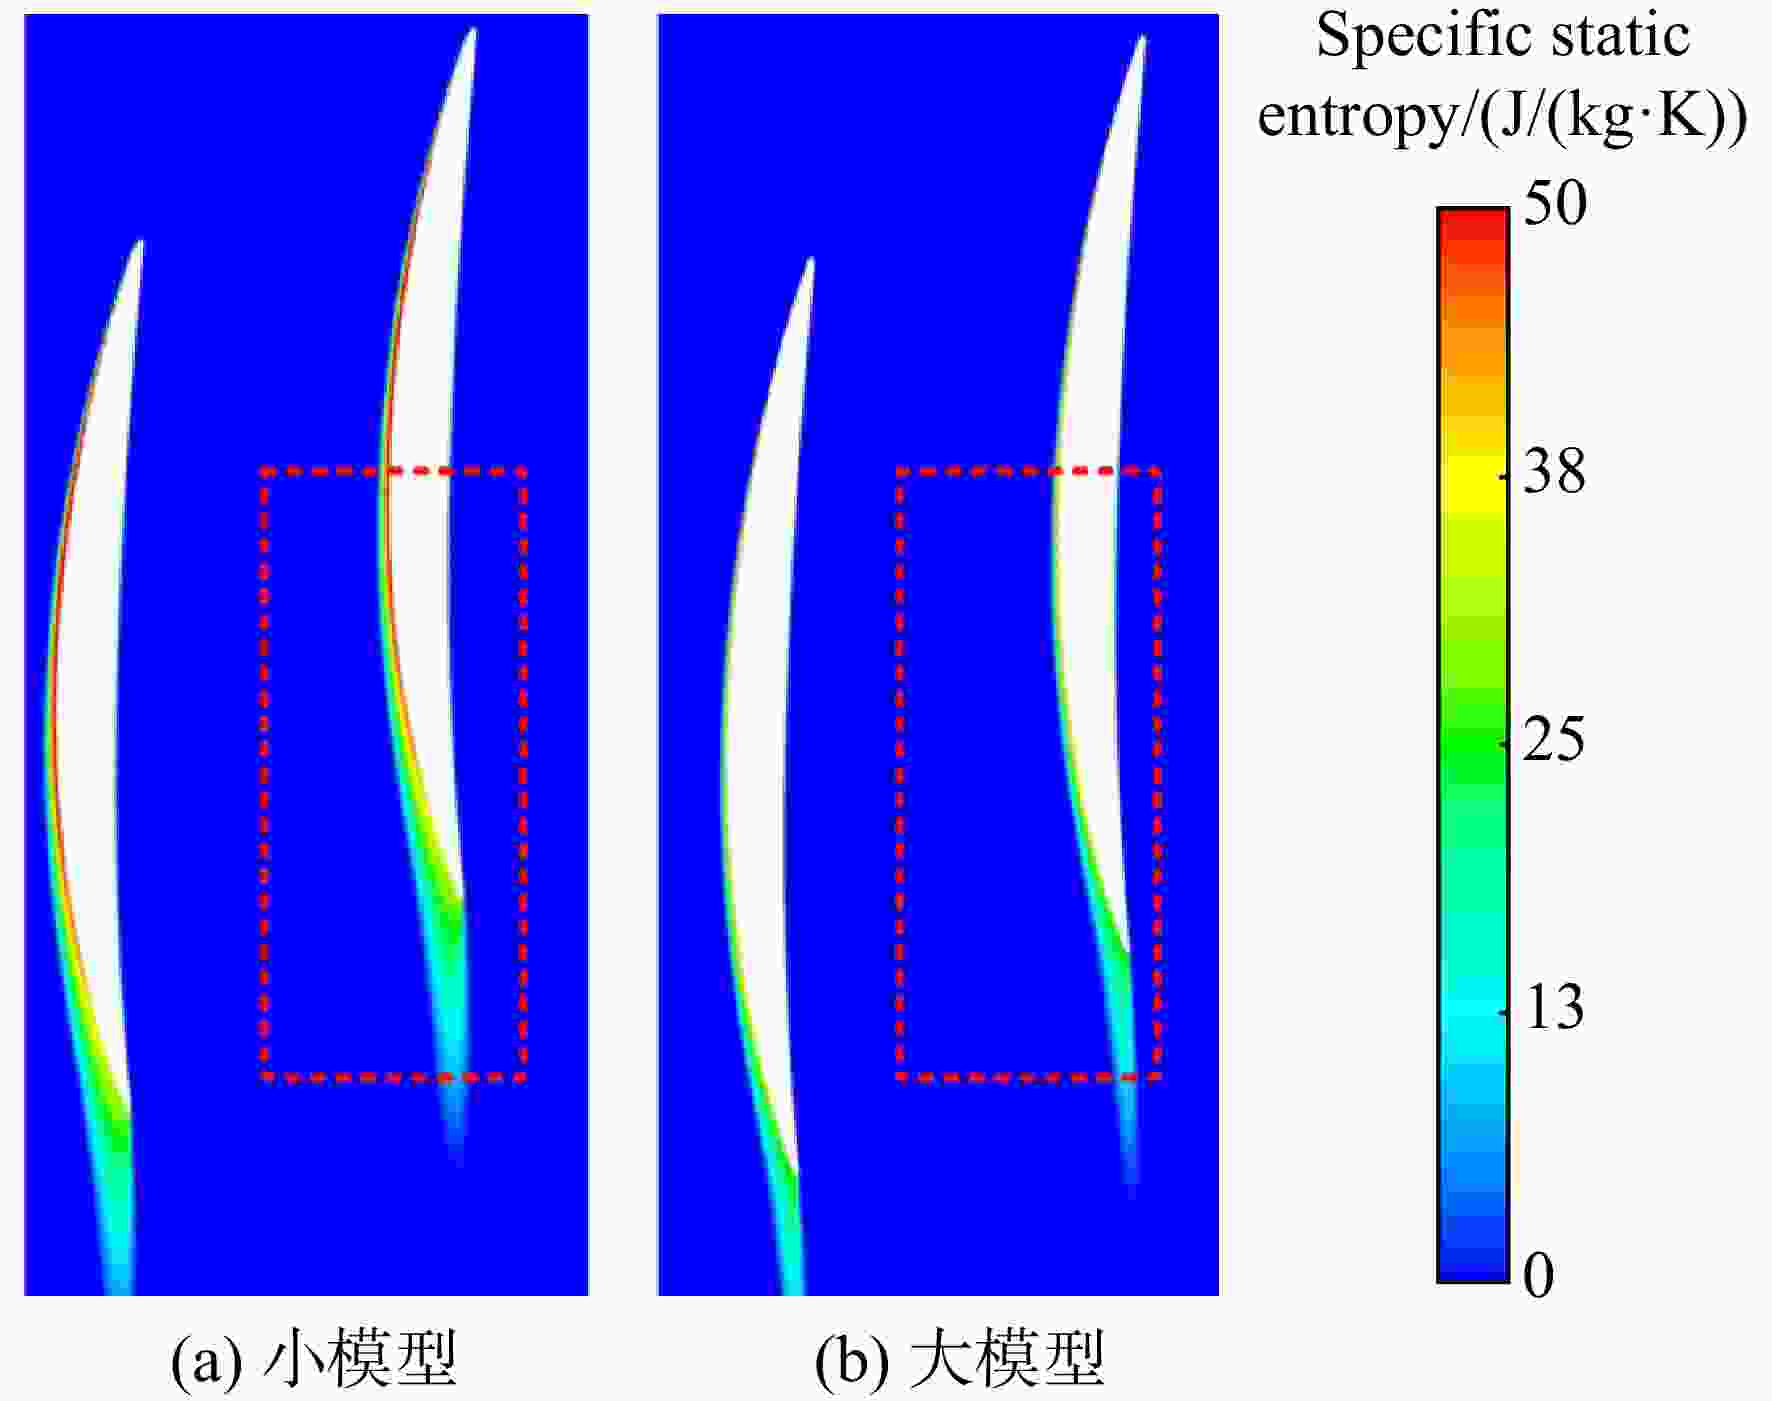
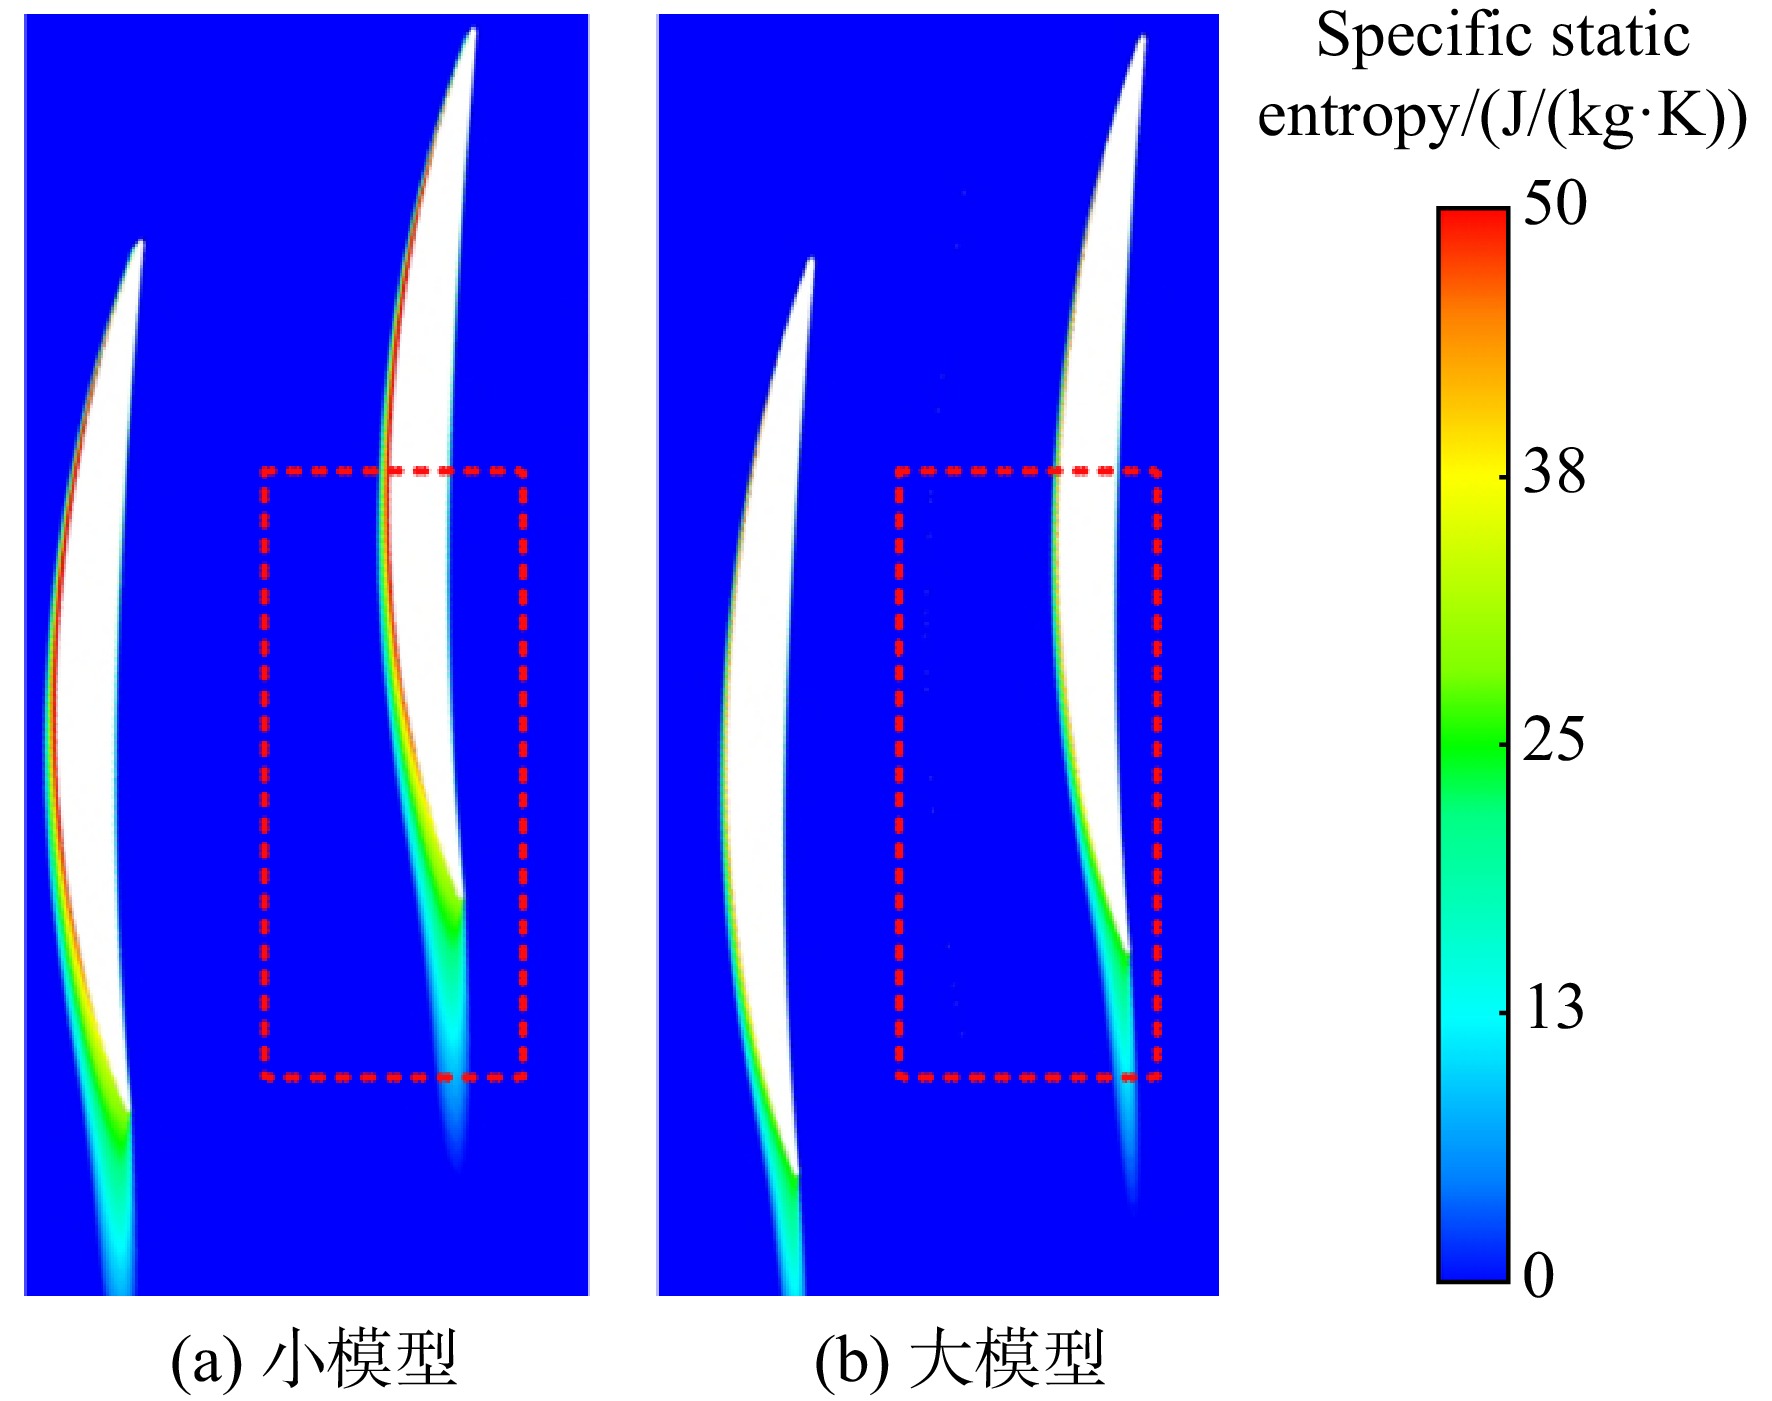
图 35 小模型/大模型30%叶高静熵云图
Figure 35. Comparison of 30% spanwise static entropy contour between the prototype and scaled-up model
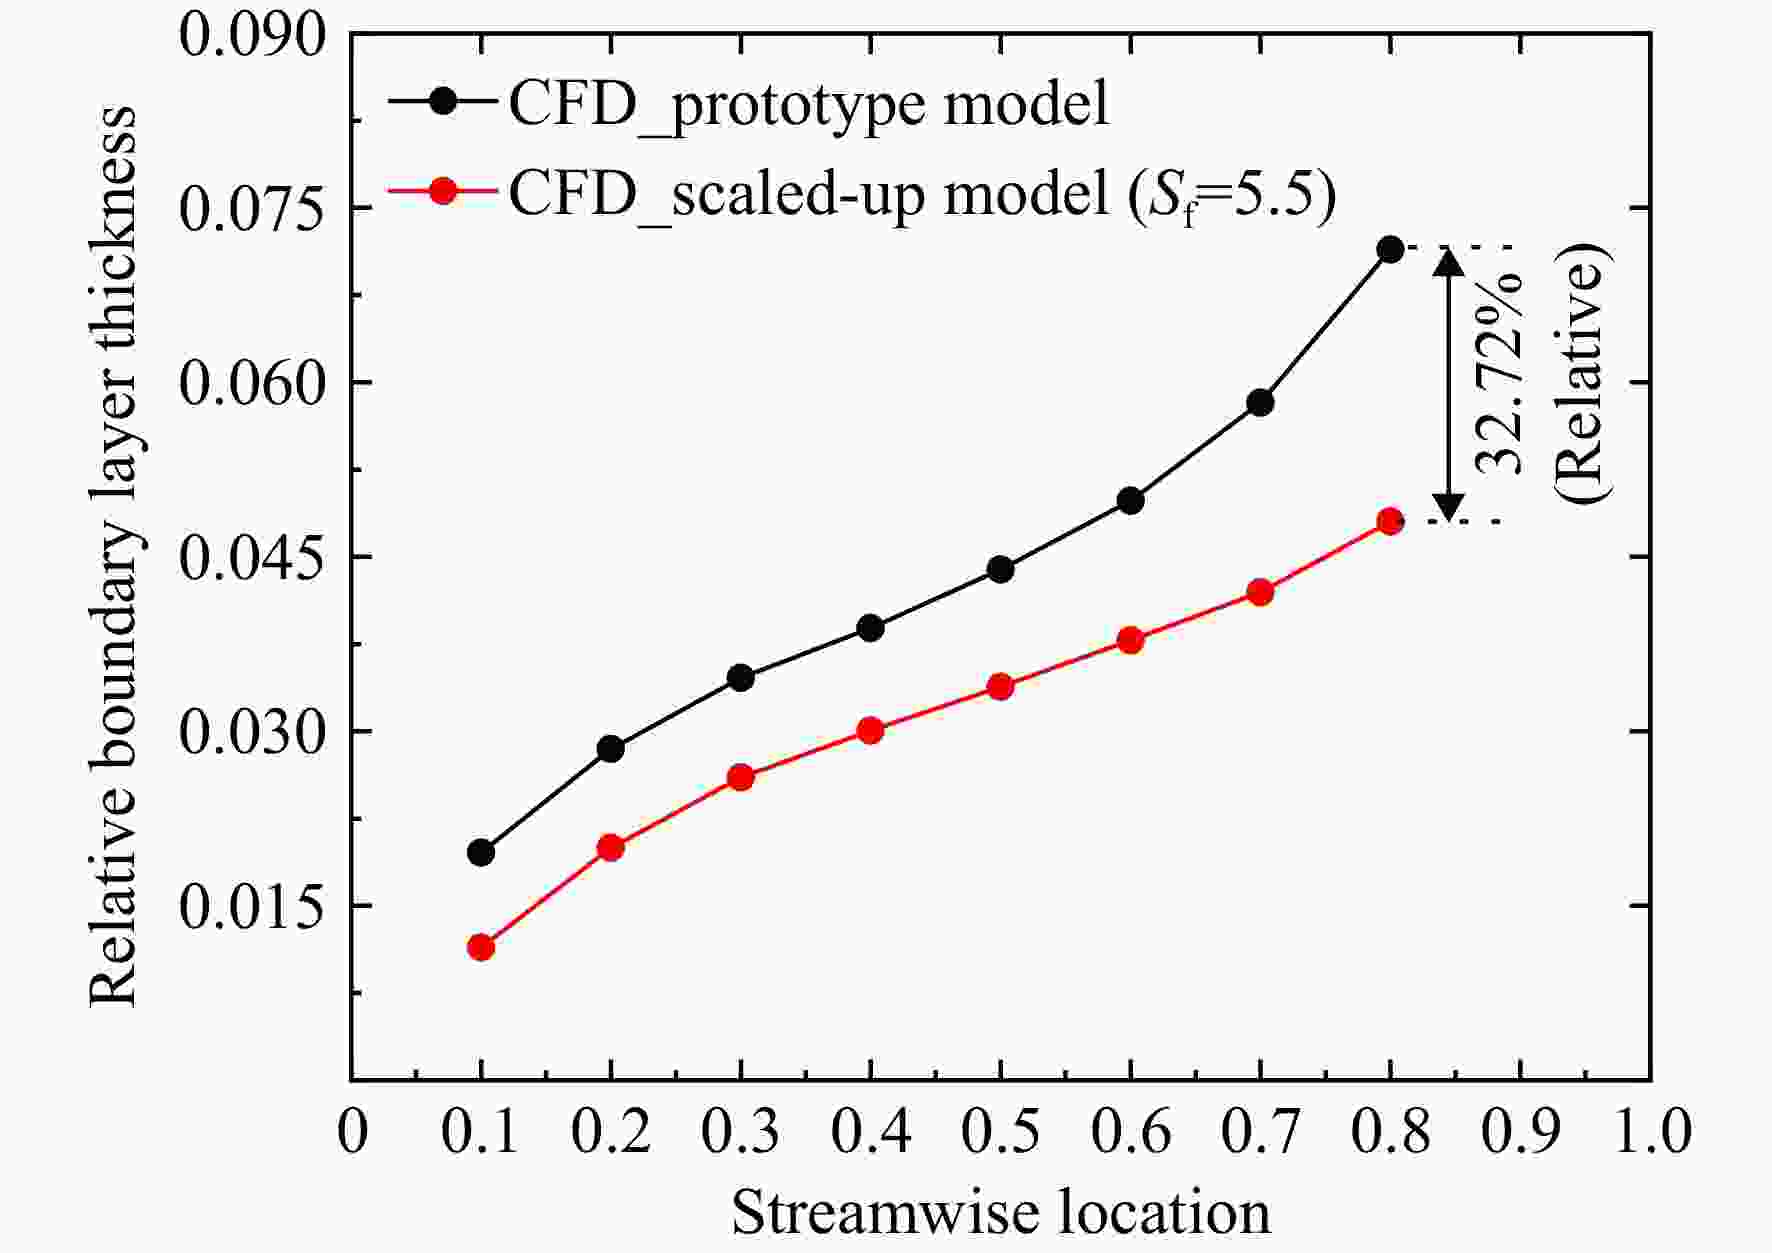
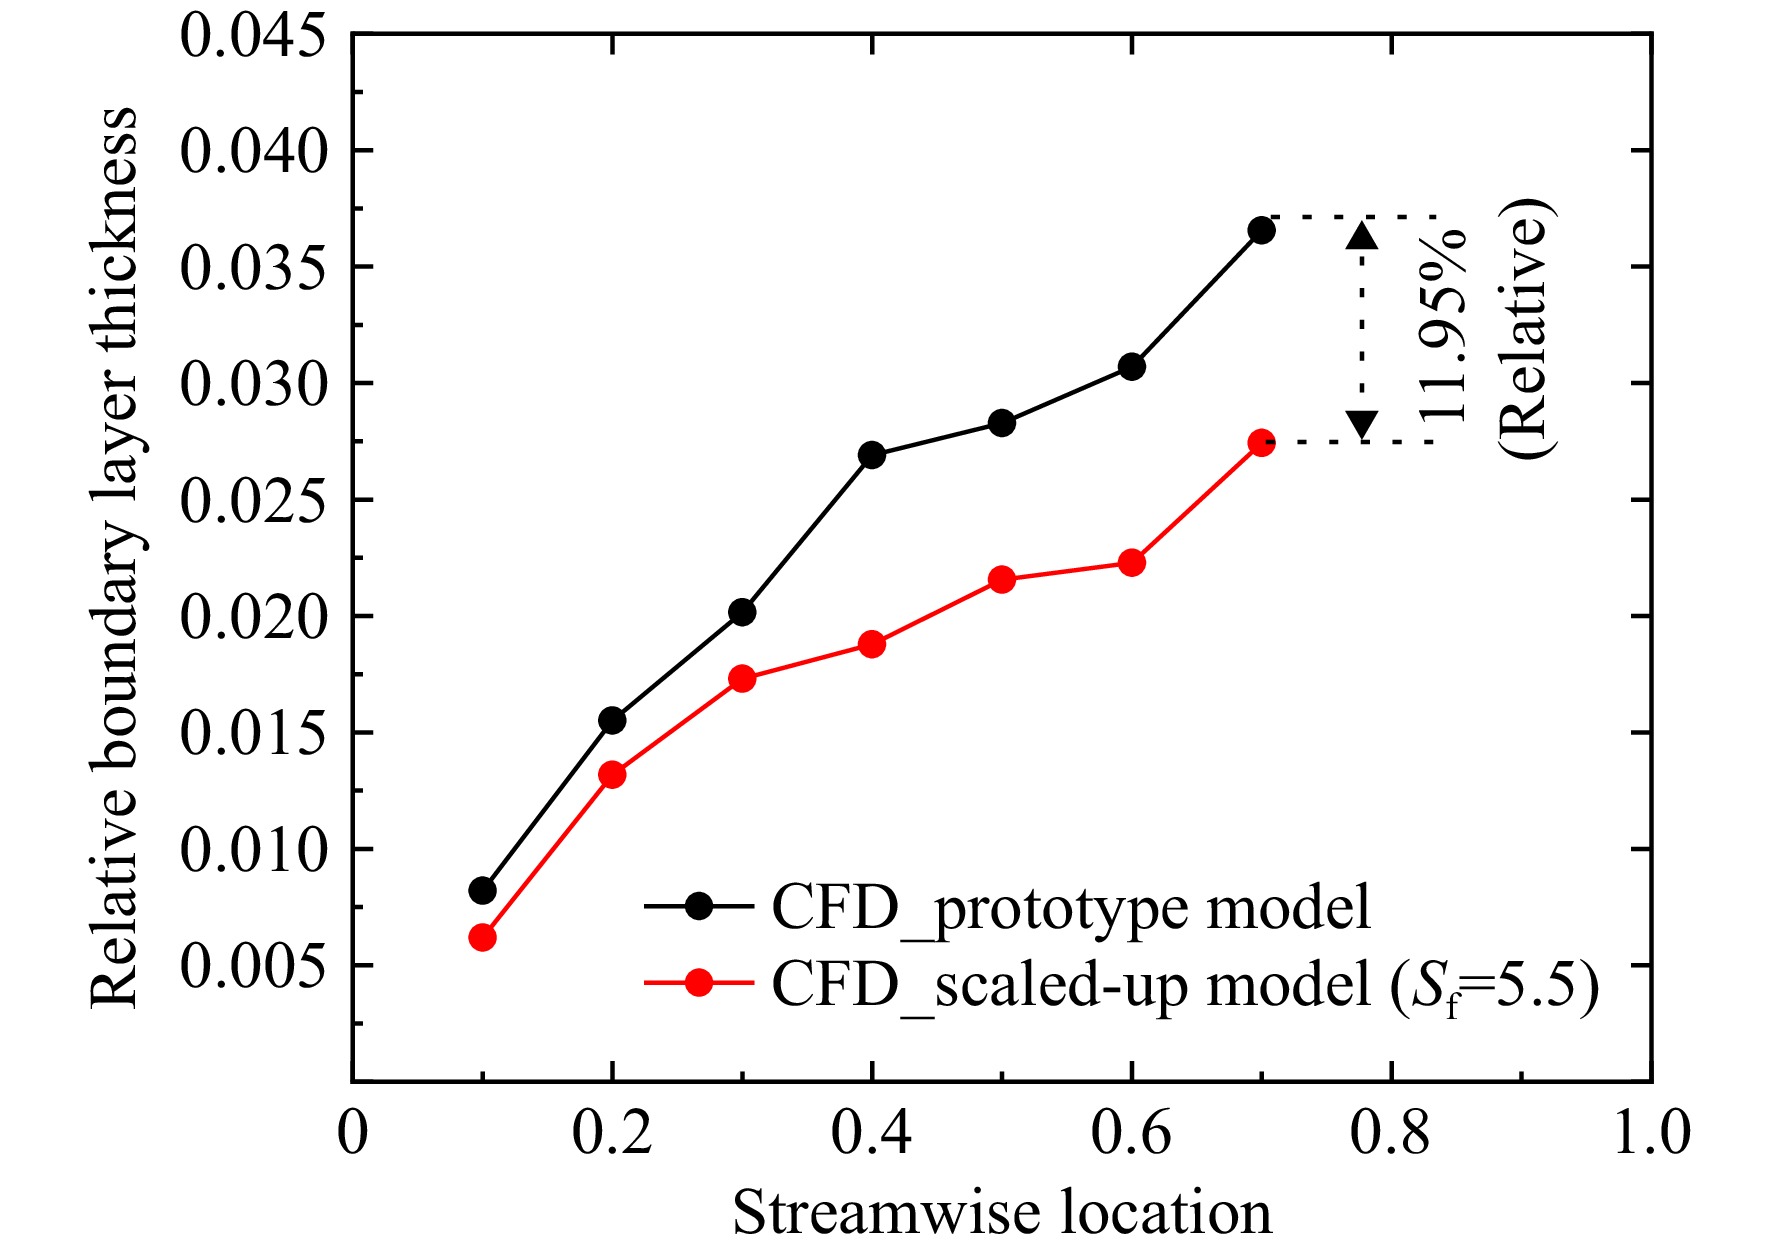
图 36 小/大模型30%叶高相对边界层厚度
Figure 36. Comparison of 30% spanwise relative boundary layer thickness between the prototype and scaled-up model
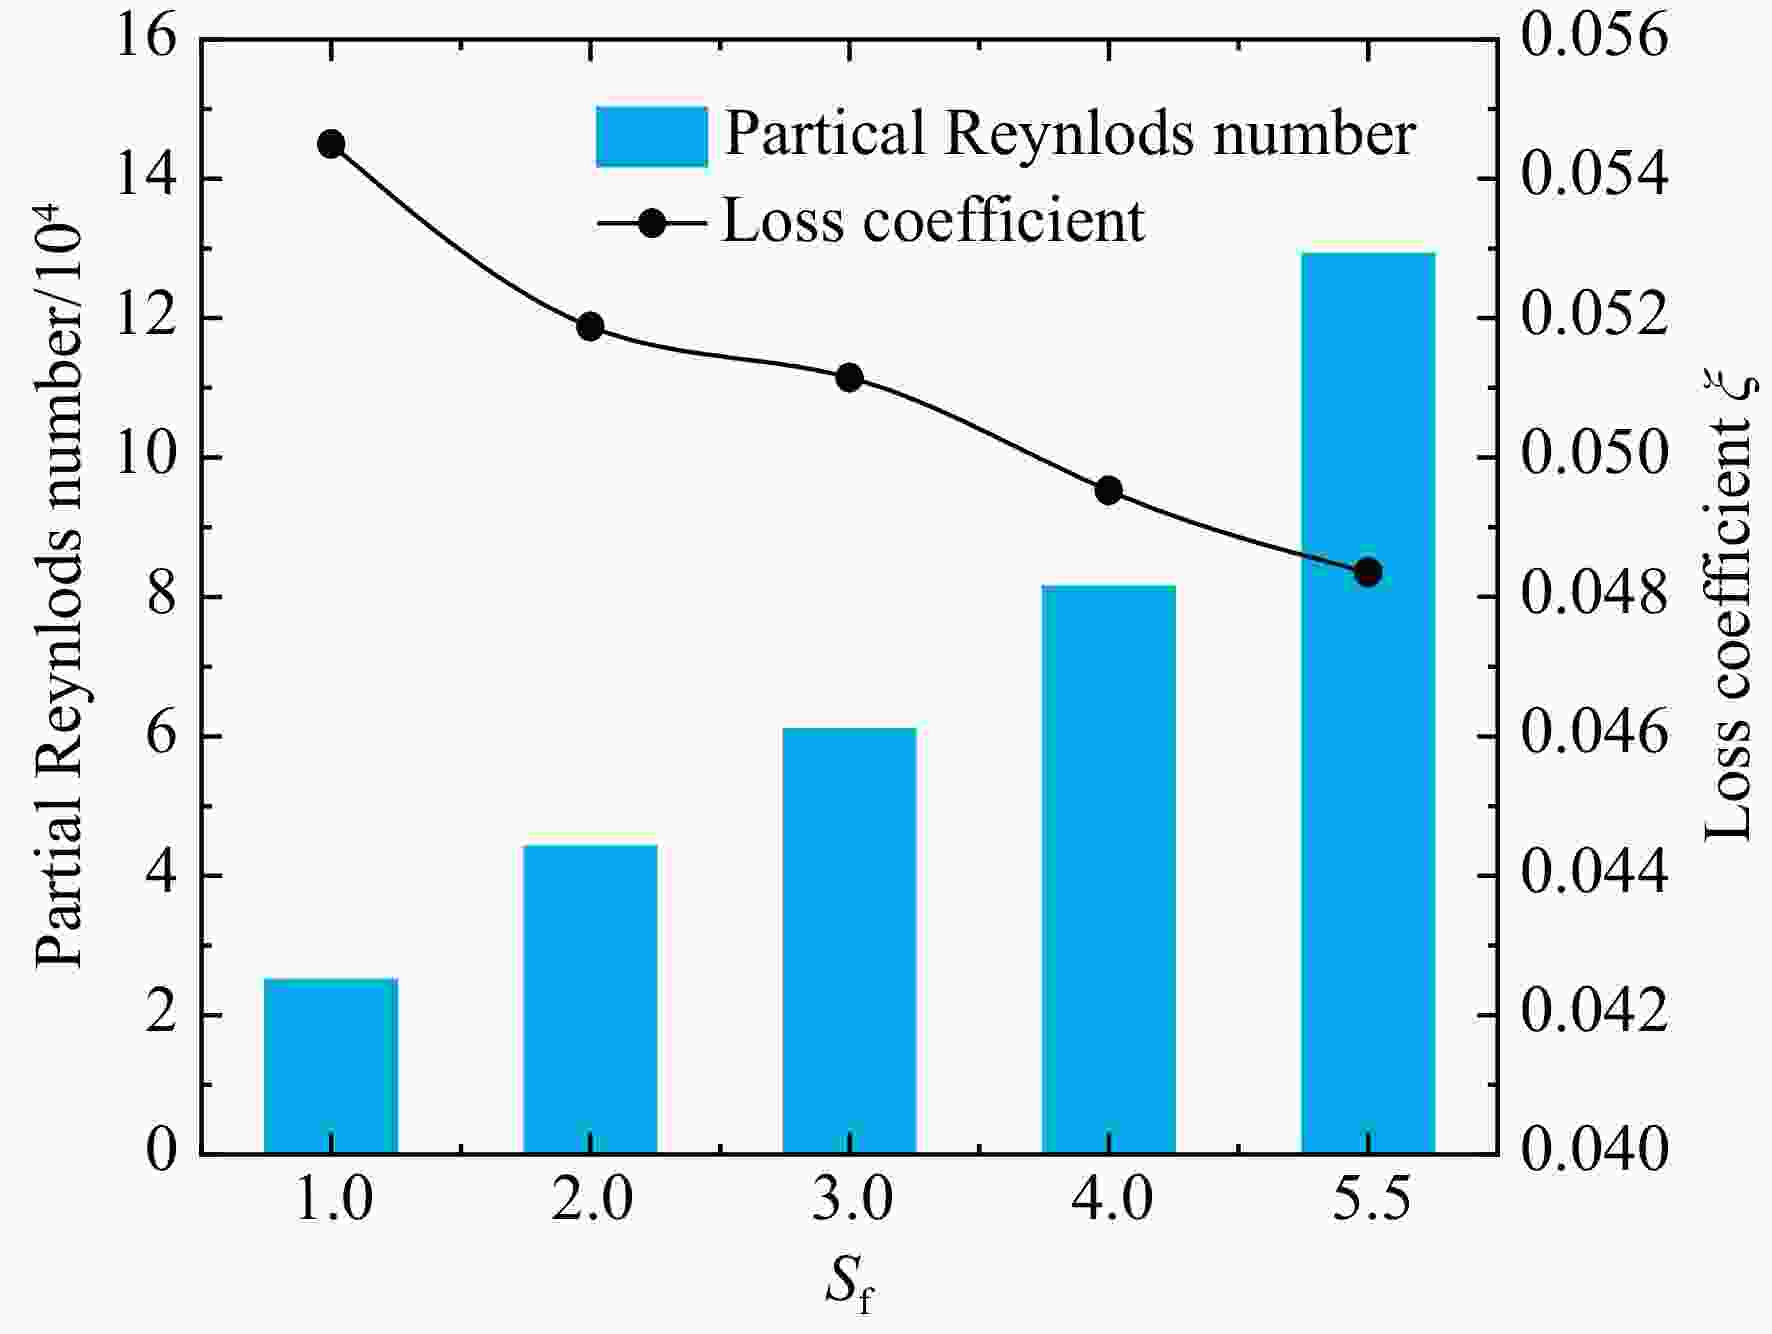
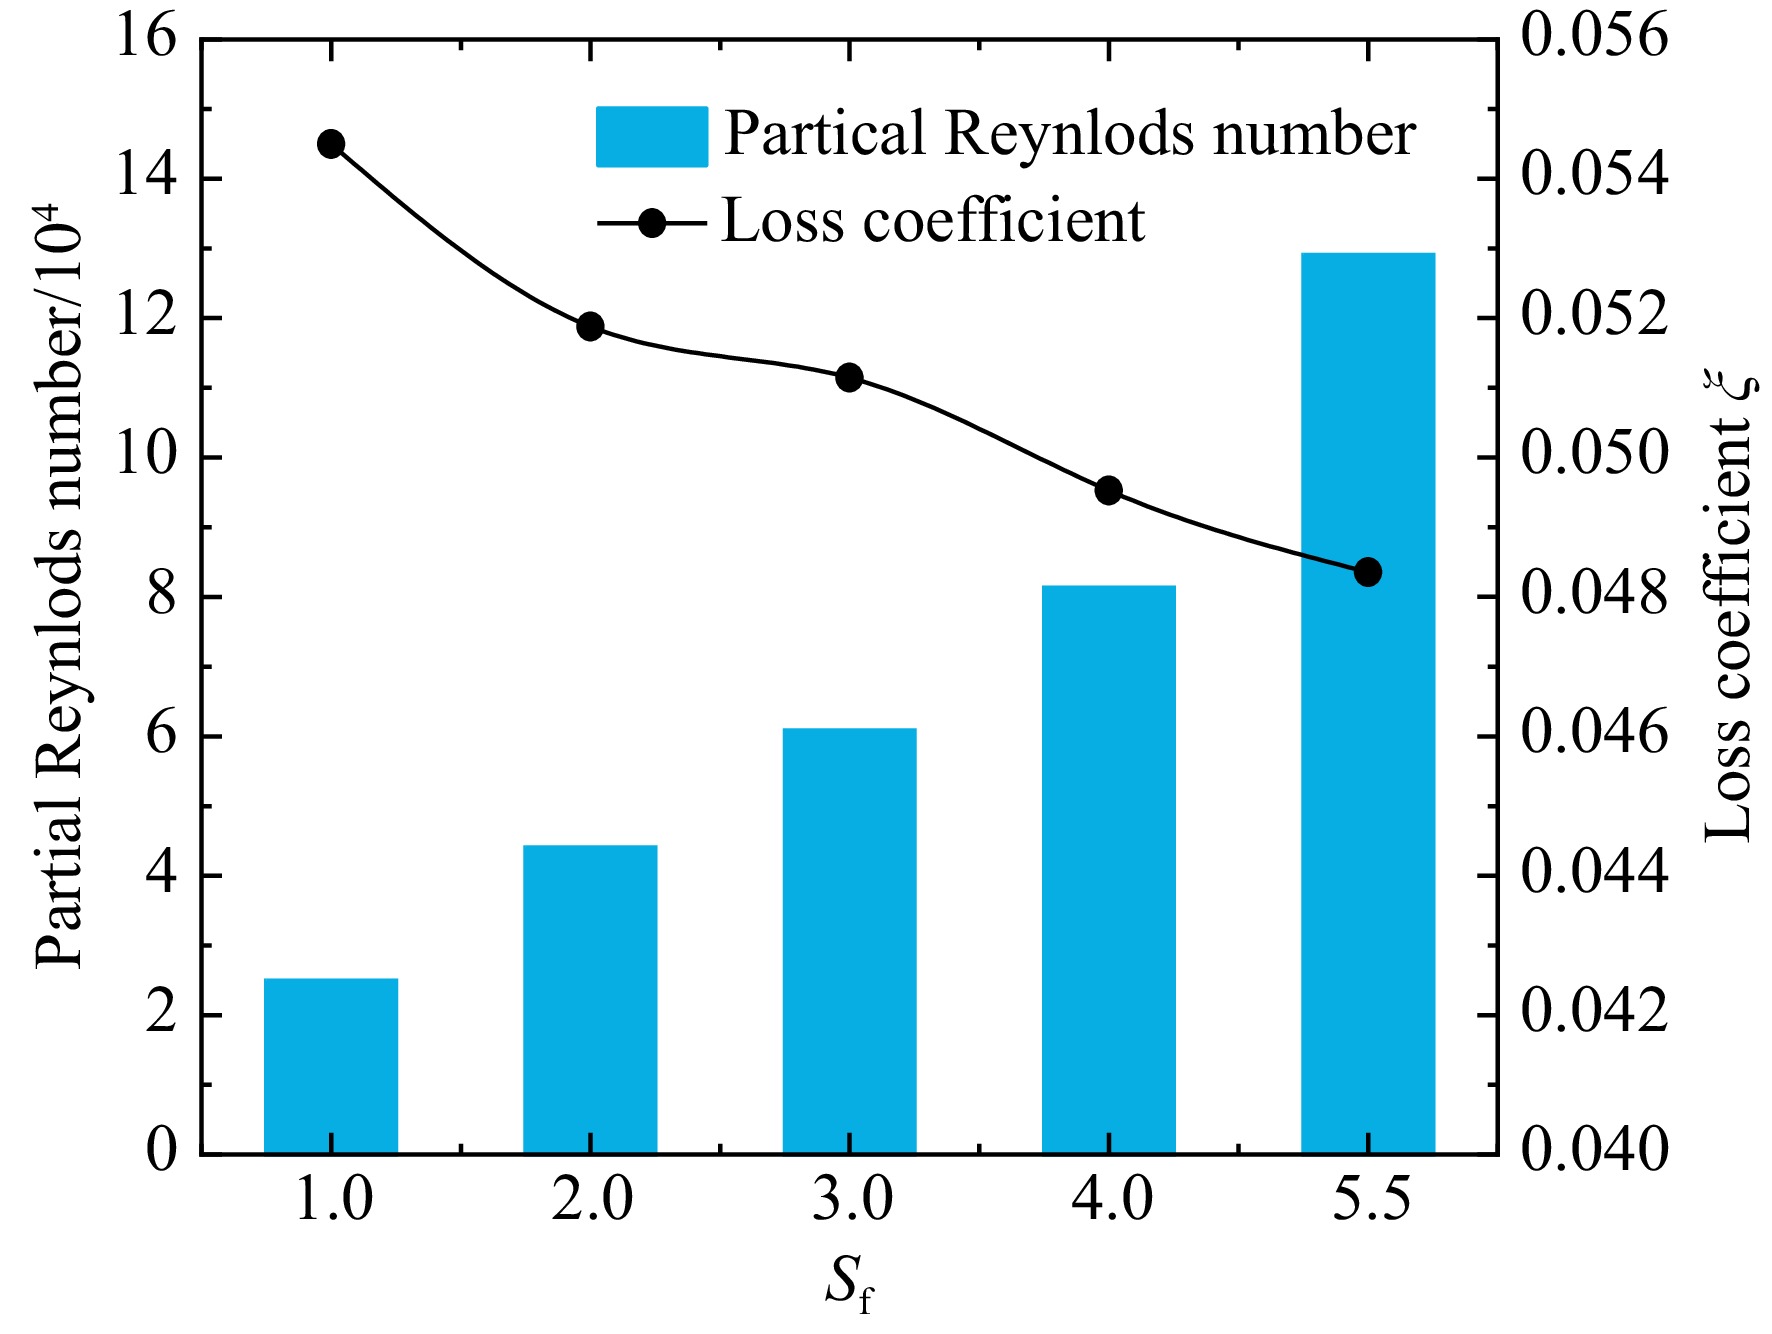
图 37 小/大模型95%叶高70%弦长局部雷诺数和尺寸效应对损失影响
Figure 37. Comparison of 95% spanwise and 70% chordwise partial Reynolds number and scaling effects on loss coefficient between the prototype and scaled-up model
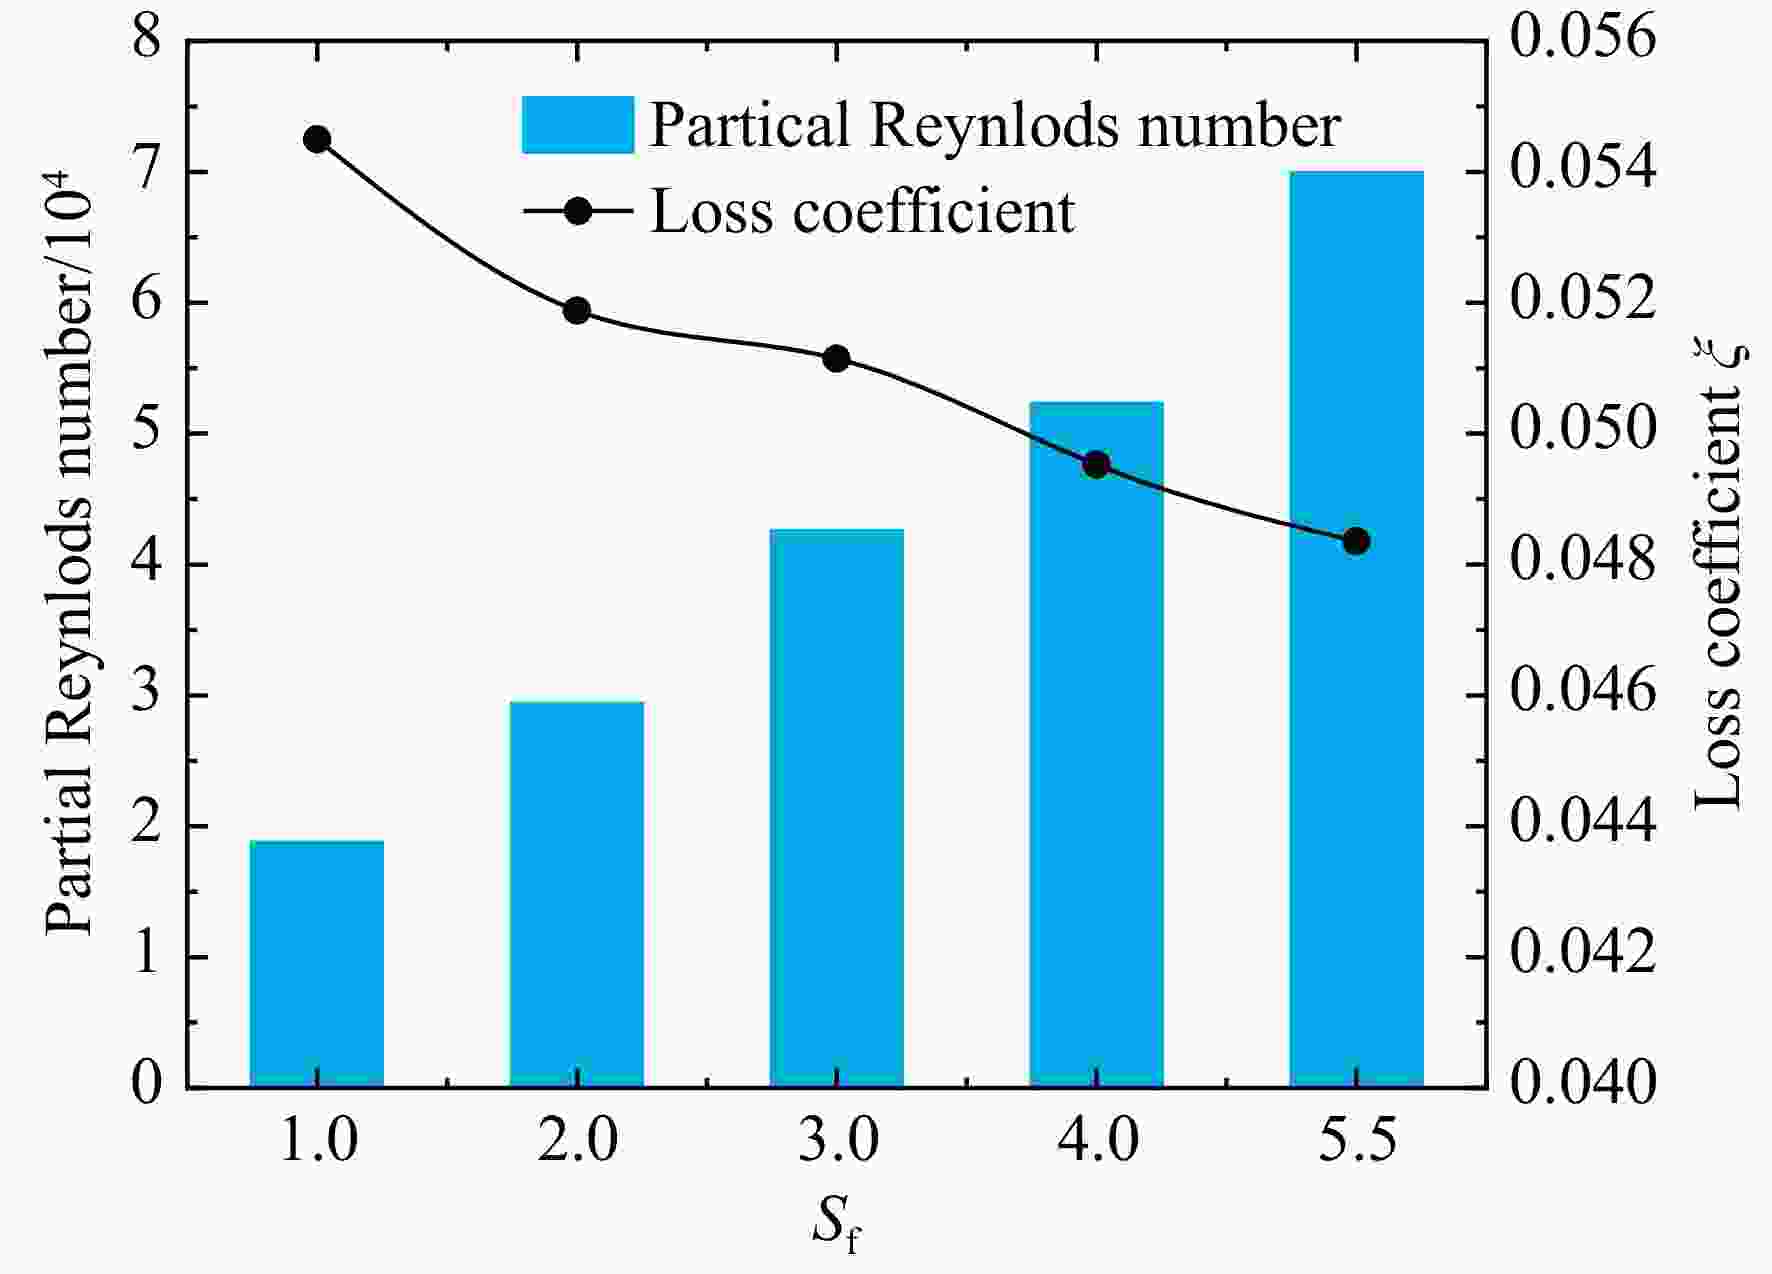
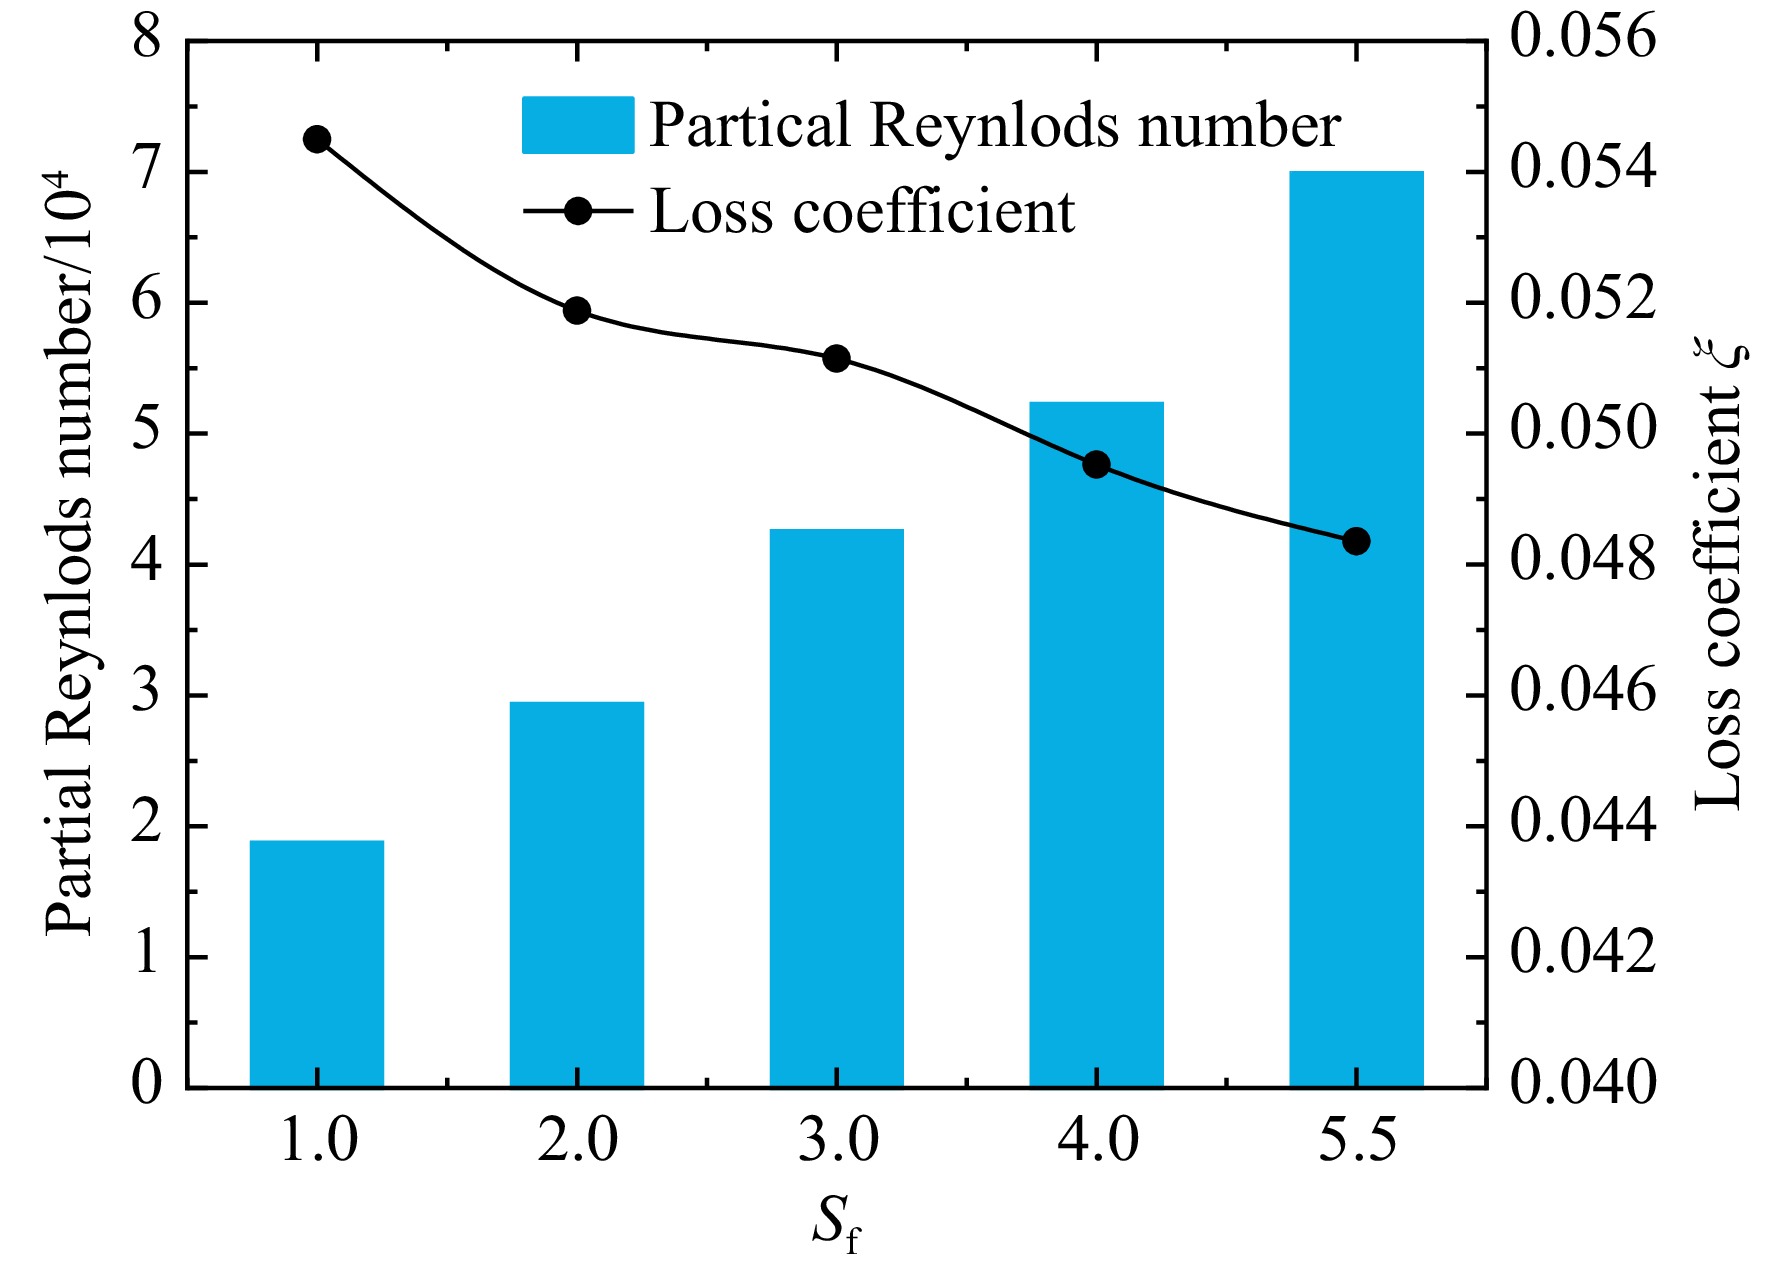
图 38 小/大模型30%叶高70%弦长局部雷诺数和尺寸效应对损失影响
Figure 38. Comparison of 30% spanwise and 70% chordwise partial Reynolds number and scaling effects on loss coefficient between the prototype and scaled-up model
表 1 Rotor 67几何和气动特性参数
Table 1. Rotor 67 geometry and aerodynamic characteristic parameters
设计参数 数值 转子叶片数 22 转子展/弦比 1.56 设计总压比 1.63 设计间隙/mm 1.016 旋转速度/(r/min) 16043 叶尖速度/(m/s) 429 堵点质量流量/(kg/s) 34.96 设计点质量流量/(kg/s) 33.25 转子进出口叶尖直径/m 0.514/0.485  下载: 导出CSV
表 2 跨声速压气机设计点参数
Table 2. Transonic compressor design point parameters
设计参数 数值 转子叶片数 17 转子展/弦比 0.956 设计总压比 1.6 设计间隙/mm 0.9 旋转速度/(r/min) 22000 叶尖速度/(m/s) 409.85 等熵效率 0.88 设计点质量流量/(kg/s) 13.5 转子进出口叶尖直径/m 0.356
下载: 导出CSV
-
[1] DIEHL M,SCHREIBER C,SCHIFFMANN J. The role of Reynolds number effect and tip leakage in compressor geometry scaling at low turbulent Reynolds numbers[J]. Journal of Turbomachinery,2020,142(3): 031003. doi: 10.1115/1.4045465 [2] ZHANG Xiawen,JU Yaping,ZHANG Chuhua. Geometry scaling technique and application to aerodynamic redesign of multi-stage transonic axial-flow compressors[J]. Aerospace Science and Technology,2022,121: 107303. doi: 10.1016/j.ast.2021.107303 [3] MOODY L F. Friction factors for pipe flow[J]. Journal of Fluids Engineering,1944,66(8): 671-678. [4] PELZ P F,SAUL S,BRÖTZ J. Efficiency scaling: influence of Reynolds and Mach numbers on fan performance[J]. Journal of Turbomachinery,2022,144(6): 061001. doi: 10.1115/1.4053172 [5] DIETMANN F,CASEY M. The effects of Reynolds number and roughness on compressor performance[R]. Lappeenranta,Finland: the European Conference on Turbomachinery Fluid Dynamics & Thermodynamics ETC10,2013. [6] CASEY M V,ROBINSON C J. A unified correction method for Reynolds number,size,and roughness effects on the performance of compressors[J]. Proceedings of the Institution of Mechanical Engineers,Part A: Journal of Power and Energy,2011,225(7): 864-876. doi: 10.1177/0957650911410161 [7] SCHLEER M,ABHARI R S. Influence of geometric scaling on the stability and range of a turbocharger centrifugal compressor[R]. ASME Paper GT2005-68713,2005. [8] IKEGUCHI T,MATSUOKA A,SAKAI Y,et al. Design and development of a 14-stage axial compressor for industrial gas turbine[R]. ASME Paper GT2012-68524,2012. [9] AUGUSTYN O P,VAN DER SPUY S J,VON BACKSTRÖM T W. Numerical and experimental investigation into the accuracy of the fan scaling laws applied to large diameter axial flow fans[J]. Proceedings of the Institution of Mechanical Engineers,Part A: Journal of Power and Energy,2016,230(5): 477-486. doi: 10.1177/0957650916633015 [10] DUFOUR G,CARBONNEAU X,CAZALBOU J B,et al. Practical use of similarity and scaling laws for centrifugal compressor design[R]. ASME Paper GT2006-91227,2006. [11] ERNST B,KAMMEYER J,SEUME J R. Improved map scaling methods for small turbocharger compressors[R]. ASME Paper GT2011-45345,2011. [12] KOCH C C,SMITH L H Jr. Loss sources and magnitudes in axial-flow compressors[J]. Journal of Engineering for Power,1976,98(3): 411-424. doi: 10.1115/1.3446202 [13] DENTON J D. Loss mechanisms in turbomachines[J]. Journal of Turbomachinery,1993,115(4): 621-656. doi: 10.1115/1.2929299 [14] STORER J A,CUMPSTY N A. Tip leakage flow in axial compressors[J]. Journal of Turbomachinery,1991,113(2): 252-259. doi: 10.1115/1.2929095 [15] KHALID S A,KHALSA A S,WAITZ I A,et al. Endwall blockage in axial compressors[J]. Journal of Turbomachinery,1999,121(3): 499-509. doi: 10.1115/1.2841344 [16] MEE D J,BAINES N C,OLDFIELD M L G,et al. An examination of the contributions to loss on a transonic turbine blade in cascade[J]. Journal of Turbomachinery,1992,114(1): 155-162. doi: 10.1115/1.2927979 [17] MEE D J,BAINES N C,OLDFIELD M L G. Detailed boundary layer measurements on a transonic turbine cascade[J]. Journal of Turbomachinery,1992,114(1): 163-172. doi: 10.1115/1.2927980 [18] PAMPREEN R C. Small turbomachinery compressor and fan aerodynamics[J]. Journal of Engineering for Power,1973,95(3): 251-256. doi: 10.1115/1.3445730 [19] NOVAK D,LOETZERICH M,BOESE M. Aerodynamic design and testing of an axial flow compressor for the GT24/26 gas turbines[R]. ASME Paper GT2013-95067,2013. [20] MA Yan,XI Guang. Effects of Reynolds number and heat transfer on scaling of a centrifugal compressor impeller[C]//ASME Turbo Expo 2010: Microturbines & Small Turbomachinery. Glasgow,UK: American Society of Mechanical Engineers,2010: 565-572. [21] XIE Hong,YANG Bo,ZHANG Shuyi,et al. Performance analysis and improvement of a centrifugal compressor based on partial similarity principle[J]. Journal of Engineering for Gas Turbines and Power,2020,142(5): 051012. doi: 10.1115/1.4046925 [22] TIAINEN J,JAATINEN-VÄRRI A,GRÖNMAN A,et al. Numerical study of the Reynolds number effect on the centrifugal compressor performance and losses[R]. ASME Paper GT2016-56036,2016. [23] WADIA A R,WOLF D P,HAASER F G. Aerodynamic design and testing of an axial flow compressor with pressure ratio of 23.3: 1 for the LM2500+ gas turbine[J]. Journal of Turbomachinery,2002,124(3): 331-340. doi: 10.1115/1.1464562 [24] STRAZISAR A J,WOOD J R,HATHAWAY M D,et al. Laser anemometer measurements in a transonic axial-flow fan rotor[R]. NASA-TP-2879,1989. [25] ARIMA T,SONODA T,SHIROTORI M,et al. A numerical investigation of transonic axial compressor rotor flow using a low-reynolds-number k-ε turbulence model[J]. Journal of Turbomachinery,1999,121(1): 44-58. doi: 10.1115/1.2841233 [26] LEVY Y,DEGANI D,SEGINER A. Graphical visualization of vortical flows by means of helicity[J]. AIAA Journal,1990,28(8): 1347-1352. doi: 10.2514/3.25224 [27] TIAINEN J,JAATINEN-VÄRRI A,GRÖNMAN A,et al. Effect of freestream velocity definition on boundary layer thickness and losses in centrifugal compressors[J]. Journal of Turbomachinery,2018,140(5): 051003. doi: 10.1115/1.4038872 -



 点击查看大图

计量
- 文章访问数: 514
- HTML浏览量: 332
- PDF量: 48
- 被引次数: 0